F.C.C. earned ¥18.76bn of net income in the year ended March 2026, at a 7.2% net margin. In the year ended March 2024 those figures were ¥12.23bn and 5.1%. At an estimated share price of 4,140 yen, basic EPS of 387.36 yen puts the multiple at about 10.7x, and the price sits slightly under book value of 4,232.83 yen per share. On that page, the stock looks like a record-profit bargain.
Owner earnings say something else. They fell from ¥16.819bn to ¥11.62bn, then recovered only to ¥13.614bn. Capex, including intangibles, rose from ¥8.273bn to ¥16.451bn, and the securities report plans ¥21.5bn for the year ending March 2027. On 4 August 2026 the company set its own forecast for parent net income at ¥17bn. A record in accounting profit is not evidence that the clutch business will keep that cash.
Motorcycle clutches earn about 10%. The new lines do not
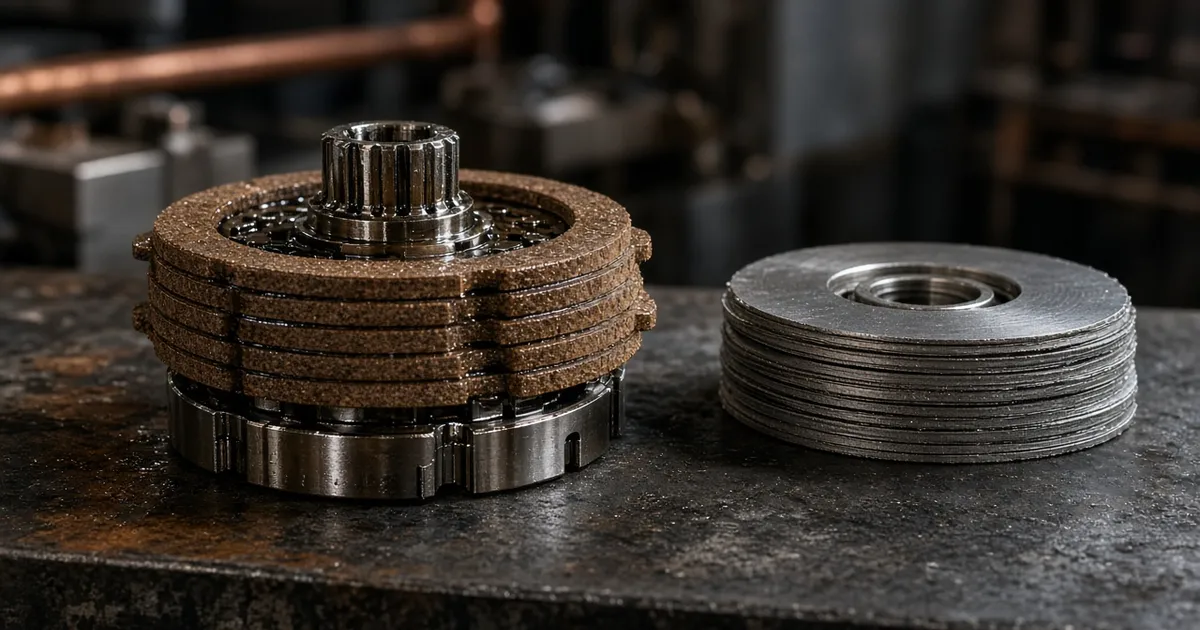
F.C.C., based in Hamamatsu, makes clutches from its own friction material through to the finished assembly. Motorcycles and cars are almost the entire business. External sales in the year ended March 2026 were ¥124.691bn in motorcycles, ¥135.975bn in cars, and ¥0.169bn in the non-mobility segment. Operating profit was ¥12.230bn in motorcycles (about 9.8% of sales) and ¥9.156bn in cars (about 6.7%). Non-mobility posted an operating loss of ¥2.459bn, after a ¥2.855bn loss the year before.
Motorcycle sales rose 3.6%, on India and Brazil. The company puts its India clutch share above 70%, on its own count. Car volumes in North America were higher, but a stronger yen left car sales 0.1% lower. A ¥2.158bn tariff hit was more than offset by lower product-warranty charges and lower depreciation in the United States, so car operating profit rose 13.0%.
The customer list is concentrated. The securities report puts the Honda group at about 36% of sales. Add the Ford group at ¥52.574bn (20.2%) and General Motors at ¥24.089bn (9.2%), and those three relationships are 64.9% of sales. This is a product sale, not a subscription.
What holds the business in place is making the friction material and the finished clutch in one chain, and the depth of the motorcycle clutch franchise in India. The exposure is that those clutches still depend on combustion engines, while spending that has not yet become sales sits next to the reported profit.
Revenue barely moved. Net income did
| Metric | 2024 | 2025 | 2026 |
|---|---|---|---|
| Revenue (¥bn) | 240.28 | 256.62 | 260.84 |
| Net income (¥bn) | 12.23 | 15.86 | 18.76 |
| Net profit margin | 5.1% | 6.2% | 7.2% |
The columns are fiscal years ended March. Revenue rose from ¥240.28bn to ¥260.84bn, only 8.6% over three years. The securities report puts the latest year’s growth at 1.6%. Motorcycle growth filled in a flat car year, and non-mobility is under 1% of consolidated sales.
Net income rose for three straight years, from ¥12.23bn to ¥15.86bn to ¥18.76bn. The latest gain was 18.3%, ahead of the 9.2% increase in operating profit (to ¥18.927bn). Pretax profit was ¥21.567bn, up 7.6%. Tax explains most of the gap. The rate reconciliation in the securities report shows the effective tax rate falling from 20.7% to 12.8%. I do not treat 12.8% as the rate that will hold next year.
The company’s forecast for the year ending March 2027, revised on 4 August 2026, is revenue of ¥265bn, operating profit of ¥22bn, pretax profit of ¥24bn, and parent net income of ¥17bn. Net income of ¥17bn is about 71% of pretax profit of ¥24bn. This year’s parent net income of ¥18.760bn was about 87% of pretax profit of ¥21.567bn. The company is not assuming that as much profit survives tax as it did this year. It also notes that the ¥22bn operating-profit forecast excludes quality-related costs that were inside last year’s operating profit. The step from ¥18.927bn to ¥22bn is not a like-for-like increase.
The first quarter, April to June 2026, delivered revenue of ¥71.800bn (up 18.3%), operating profit of ¥7.032bn (up 38.8%), and parent quarterly net income of ¥5.814bn (up 24.3%), on Indian motorcycles, North American cars, and a weaker yen. Demand held up through June. The full-year net income forecast is still ¥17bn, so the quarter does not become a full-year owner-earnings figure.
A ¥21.5bn capex plan undercuts the cheap screen
(* Simulation assumptions: estimated share price 4,140 yen, required return 5%)
| Metric | 2024 | 2025 | 2026 |
|---|---|---|---|
| Owner earnings (¥bn) | 16.819 | 11.62 | 13.614 |
| Owner earnings value (¥bn) | 336.38 | 232.4 | 272.28 |
Owner earnings are parent net income, plus depreciation and amortization from the cash flow statement, minus capex including intangibles. For the year ended March 2026 that is ¥18.760bn + ¥11.305bn − ¥16.451bn = ¥13.614bn, which matches the table. Depreciation fell from ¥12.861bn to ¥12.170bn to ¥11.305bn. Capex went from ¥8.273bn to ¥16.409bn and stayed at ¥16.451bn. That is why net income rose and owner earnings did not come back.
This year’s capex split was ¥6.748bn in motorcycles, ¥5.536bn in cars, and ¥4.167bn in non-mobility. The securities report lists Indian motorcycle-clutch capacity, motor cores and motor assemblies for electric motorcycles, motor cores for electric cars, Vietnam capacity, and a building in Japan. Non-mobility spent ¥4.167bn of capex and ¥2.508bn of R&D (company R&D was ¥8.513bn) against ¥0.169bn of sales.
Next year’s plan is larger. The capex section of the securities report puts the year ending March 2027 at ¥21.5bn: ¥7.5bn motorcycles, ¥12.960bn cars, and ¥1.040bn environment and energy. The increase sits in cars, not in the loss-making non-mobility segment. The named projects are motor cores for electric cars in North America and Japan, plus more car-clutch capacity. Those motor cores are not yet a sales line that replaces clutch profit.
Owner earnings value of ¥272.28bn is about 1.36 times the simulated market cap of ¥200.520bn, which is the treasury-adjusted share count times 4,140 yen. The exchange market cap on 23 October 2026 was ¥211.374bn, at the same 4,140 yen close. The gap is the treatment of treasury shares. If this year’s ¥13.614bn of owner earnings persists, capitalizing it at 5% leaves the value above that simulated market cap. Five percent of ¥200.520bn is about ¥10bn. Owner earnings below that line would put capitalized value under the simulated market cap.
Hold depreciation at this year’s ¥11.305bn, then use the company’s net income forecast and capex plan: ¥17bn + ¥11.305bn − ¥21.5bn is about ¥6.8bn, or about ¥136.1bn capitalized at 5%. That sits below the simulated market cap. Depreciation will rise as the new assets come into use, so ¥6.8bn is an illustration, not a forecast. The published plan still points away from holding owner earnings at ¥13.614bn. That figure already deducts ¥16.451bn of capex. A ¥21.5bn plan widens the deduction.
Operating cash flow in the five-year summary fell from ¥35.383bn to ¥27.930bn to ¥22.779bn, the opposite direction from net income. Over five years, the mid-term plan allocates ¥80bn to growth investment, ¥60bn to the core business, ¥40bn to strategic investment, and ¥70bn to shareholder returns. Those amounts describe an intention to use cash on hand. They are not spending the company has already committed.
The cash is real. So is the plan to spend it
| Metric | 2024 | 2025 | 2026 |
|---|---|---|---|
| Net cash (¥bn) | 84.61 | 81.07 | 88.874 |
| Net current asset ratio | 41.083% | 40.439% | 44.322% |
Net cash here is (current assets − inventories) + (investment securities × 70%) − liabilities. For the year ended March 2026 it is ¥88.874bn. The net current asset ratio of 44.322% means that balance is about 44% of the same year’s simulated market cap. The parent equity ratio is 77.6%. Cash and cash equivalents are ¥71.360bn, and current time deposits add another ¥9.399bn.
The non-current “other financial assets” of ¥21.305bn inside the formula are not all equities. They include deposits and loans. Counting deposits at 100% and equities at 70% changes March 2026 net cash by about ¥1.3bn, or 1.5%. The ¥88.874bn cushion still stands.
It is not a cushion that ends the discussion. A tender offer approved on 13 May 2026, for 1,000,000 shares and ¥3.083bn, was cancelled on 31 August 2026. Returns have already started. The mid-term policy is the higher of a 50% payout ratio and DOE of 3.5%, plus ¥25bn of buybacks over five years. Dividends paid in the year ended March 2026 were ¥8.131bn. The balance sheet offers downside support today. If the mid-term spending goes ahead, that support gets thinner.
Parent equity rose from ¥184.221bn to ¥205.015bn. Retained earnings contributed ¥10.762bn, and other components of equity, including the translation reserve, contributed ¥10.015bn. A weaker yen added about as much equity as the business itself retained.
Clutches need engines, and Honda is about 36% of sales
The risk the securities report puts first is that electrification can make a clutch unnecessary. The 13th mid-term plan’s 2030 markers are motorcycle sales of ¥160bn and operating profit of ¥17bn, against car sales of ¥130bn and operating profit of ¥10bn. The car sales marker is below this year’s ¥135.975bn. Environment and energy is marked at ¥10bn of sales and ¥0.5bn of operating profit by 2030. From today’s non-mobility result, ¥0.169bn of sales and a ¥2.459bn operating loss, that is still far from replacing clutch profit.
On customers, Honda’s purchasing policy, North American tariffs, and product-warranty charges can hit at the same time. Current provisions rose ¥1.850bn, to a note balance of ¥9.209bn. Cars absorbed a ¥2.158bn tariff hit and still grew operating profit. The filing does not say that absorption repeats.
The upside, if it comes, is still on the clutch side. Motorcycle operating margin is about 10%, and the first quarter extended the India motorcycle and North America car trends. The mid-term plan treats hybrid demand, served with existing equipment, as a way to defend car profit. The operating-profit forecast of ¥22bn excludes quality costs, and it is still the company’s number. The cheap screen is a 10.7x multiple on trailing earnings, plus net cash equal to about 44% of the simulated market cap. Both appear before owner earnings have been shown to survive the investment program.
Wait. The thing to watch is whether the investment earns
F.C.C. can earn about a 10% operating margin on motorcycle clutches. My stance is still wait. The rise to ¥18.76bn of net income includes a drop in the effective tax rate to 12.8%, and the company itself forecasts ¥17bn of net income next year. Capitalizing this year’s owner earnings of ¥13.614bn at 5% produces ¥272.28bn, above the simulated market cap. Put the securities report’s ¥21.5bn capex plan into the same formula and that cushion rests on assumptions the plan itself weakens. Net cash of ¥88.874bn is large. The mid-term plan is written to spend it.
Bullish monitoring triggers
- Capex moves down toward depreciation of ¥11.305bn, and owner earnings rise above ¥13.614bn. The securities report’s plan for next year is ¥21.5bn, so this condition is distant today. Check capex in the securities report and depreciation on the cash flow statement.
- The non-mobility operating loss shrinks from ¥2.459bn and sales rise from ¥0.169bn. Check the segment note in each earnings release.
Warning / pass triggers
- Next year’s capex is spent near the ¥21.5bn plan, and owner earnings fall below about ¥10bn (simulated market cap of ¥200.520bn × 5%). Check the capex section of the securities report, along with net income, depreciation, and capex.
- Current provisions rise further from ¥9.209bn, and motorcycle or car operating profit falls from the prior year. Do not compare the ¥22bn operating-profit forecast with ¥18.927bn directly, because the forecast excludes quality-related costs. The same caution applies if the U.S. tariff impact exceeds ¥2.158bn and presses car operating profit of ¥9.156bn, or if the Honda group rises further above about 36% of sales. Check segment operating profit, the provision note, tariff commentary, and the major-customer disclosure.
A multiple under 11x, and a large net cash balance, do not close the case. The next accounts need to separate how much clutch profit moved into motor cores and environment-and-energy projects that do not yet sell, and how much of the profit increase was the tax rate.
Want to simulate the "fair value" of F.C.C.CO.,LTD.?
Interested in digging deeper into the financial data for F.C.C.CO.,LTD. featured in this article?
At okuriru.com, you can run simulations for F.C.C.CO.,LTD. based on Buffett-style "owner earnings." Enter your required rate of return (hurdle rate) to instantly calculate a theoretical stock price.
👉 Calculate F.C.C.CO.,LTD.'s theoretical stock price
Resolve the question "Is this stock fairly priced?" using your own criteria. CSV downloads of financial data are available too!