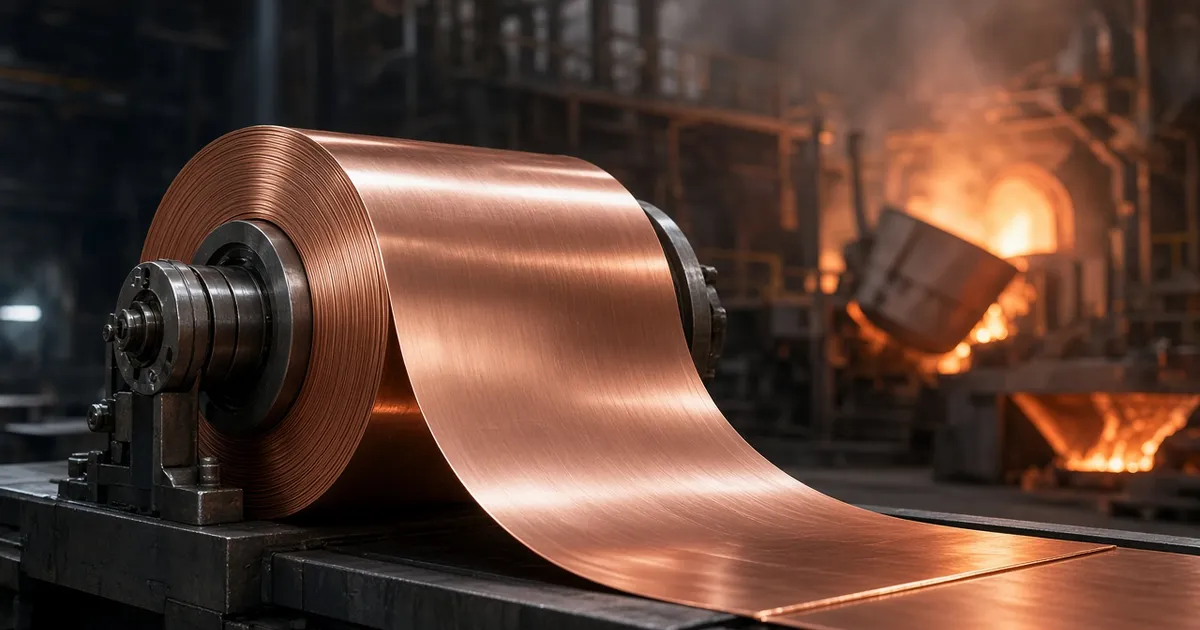
Mitsui Kinzoku (renamed from Mitsui Mining and Smelting in April 2025) closed the fiscal year ended March 2026 with revenue of ¥758.53bn and net income of ¥91.26bn, its third record year in a row. Owner earnings came to ¥85.06bn, and capitalizing them at a 5% required return gives an owner earnings value of ¥1,701.1bn. At an estimated share price of 22,975 yen (pre-split), the simulated market cap is about ¥1,314.45bn. On paper, the stock looks nearly 30% cheap.
Yet that same share price sits at roughly 40% of the May 27 high of 57,700 yen (pre-split). Record profits, a valuation that screens cheap, and a share price far below its peak: that mismatch is where this note starts. The short version is that the earnings mix two very different engines, and which one you anchor on changes how much margin of safety you see.
Copper foil for AI servers, and a smelter that rides metal prices
The main profit engine is copper foil in the functional materials segment. Two products lead: VSP™ electrodeposited copper foil for AI and other high-end servers, and MicroThin™ carrier-backed ultra-thin copper foil for semiconductor package substrates. Traders Web describes the company’s copper foil as among the world’s leaders. According to company presentations, monthly VSP™ sales volume has grown from 240 tonnes at the start of the disclosed series to roughly 780–840 tonnes recently.
The second engine is the metals segment, which smelts and recycles zinc, lead, and copper. Its smelting network has real strengths, such as processing lead-bearing feed from e-scrap and recovering tin, antimony, and bismuth. But its profits depend heavily on metal prices, the yen, and the revaluation of inventory as prices move, which the company calls the “inventory factor.”
The two engines run at very different capital efficiency. The 2030 ROIC targets in the current mid-term plan are 30% for functional materials (49% for copper foil) versus 8% for metals. A useful mental model is a high-share specialty materials maker sharing a balance sheet with a commodity smelter. The company sold all shares of its auto door-latch unit, Mitsui Kinzoku ACT, in November 2025, and is steering resources toward functional materials and new businesses.
More than half of the record came from the smelter
| Metric | 2024 | 2025 | 2026 |
|---|---|---|---|
| Revenue (¥bn) | 646.7 | 712.34 | 758.53 |
| Net income (¥bn) | 25.99 | 64.66 | 91.26 |
| Net profit margin | 4% | 9.1% | 12% |
Revenue rose from ¥646.7bn to ¥758.53bn, and the net margin tripled from 4% to 12%. The annual securities report credits higher copper foil volumes, but also higher zinc and other non-ferrous prices and the favorable inventory factor that came with them.
Splitting ordinary profit by segment makes the picture clear. In FY2026, functional materials earned ¥66.5bn and metals earned ¥75.1bn. Functional materials grew sharply from ¥40.3bn the year before, but more than half of the company’s record profit came from the smelting side, helped by commodity tailwinds.
Management’s revised guidance (August 7) for FY2027 calls for ordinary profit of ¥78.0bn in functional materials and ¥26.5bn in metals. Copper foil keeps growing, while smelting shrinks to about a third as the inventory tailwind fades and major scheduled maintenance hits the zinc and copper smelters. Group net income is guided down from ¥91.26bn to ¥80.0bn.
FY2026 net income also absorbed a ¥19.07bn loss on the sale of affiliate shares (an extraordinary loss tied to the ACT divestiture). That is why operating profit rose 75.1% while net income rose only 41.1%.
The stock only looks cheap on this year’s numbers
(* Simulation assumptions: estimated share price 22,975 yen, required return 5%)
| Metric | 2024 | 2025 | 2026 |
|---|---|---|---|
| Owner earnings (¥bn) | 28.77 | 66.46 | 85.06 |
| Owner earnings value (¥bn) | 575.46 | 1329.22 | 1701.1 |
Owner earnings (net income + depreciation − CapEx − intangible investment) roughly tripled in three years, from ¥28.77bn to ¥85.06bn. The FY2026 build is net income of ¥91.26bn plus depreciation of ¥29.76bn, minus ¥34.49bn of property, plant and equipment purchases and ¥1.48bn of intangible purchases. It is the first year in the three-year window where CapEx exceeded depreciation.
Owner earnings value of ¥1,701.1bn is about 1.3x the simulated market cap of roughly ¥1,314.45bn. Even against the live market cap (about ¥1,466.2bn as of October 2, per Monex Stock Scouter), it is about 1.16x. On this year’s numbers alone, there is a margin of safety.
So is the FY2026 figure of ¥85.06bn inflated? It contains one-offs pulling in both directions: commodity tailwinds such as the inventory factor push it up, while the loss on affiliate shares pushes it down. As a single-year number, it is not wildly overstated.
The problem is next year. Plug management’s FY2027 net income guidance of ¥80.0bn and the ¥56.0bn one-year CapEx plan from the securities report into the same formula. Assuming depreciation and intangible investment stay at this year’s levels (¥29.76bn and ¥1.48bn), the simple math gives owner earnings of about ¥52.3bn and owner earnings value of about ¥1,045.7bn, below the simulated market cap. Run the company’s own plan forward, and this year’s discount disappears.
Most of that drop comes from growth investment, though. Management plans capacity expansions of ¥30bn for MicroThin™, ¥7bn for VSP™, and ¥5bn for FaradFlex®. If those projects come back as copper foil volume, owner earnings could recover from FY2028 onward. In other words, the margin of safety here depends less on today’s earnings than on whether the copper foil investments pay back. That, to me, is the right way to read this company.
Debt is down, but half of current assets is inventory
| Metric | 2024 | 2025 | 2026 |
|---|---|---|---|
| Net cash (¥bn) | -128.74 | -80.54 | -19.70 |
| Net current asset ratio | -9.803% | -6.131% | -1.499% |
Net cash here uses a conservative definition: (current assets − inventories) + investment securities × 70% − liabilities. It improved by about ¥109bn in two years, from −¥128.74bn in 2024 to −¥19.70bn in 2026. The main driver was ¥51.9bn of repayments across borrowings, bonds, and commercial paper, which cut total liabilities from ¥317.1bn to ¥276.6bn. The equity ratio reached 59.1%, and the net D/E ratio fell to 0.14.
Net cash is still negative, and the reason is inventory. At the end of FY2026, inventories of ¥212.88bn made up almost half of ¥423.47bn in current assets. Higher metal prices inflated the value of stock on hand, and copper foil growth added more, so the cash flow statement shows a ¥50.4bn increase in inventories. That absorbed a large share of ¥87.5bn in operating cash flow.
There is no guarantee the gap keeps narrowing. The earnings release projects ¥90bn of investing cash outflow for FY2027, and the buy-side M&A budget has been raised from ¥24bn to ¥60bn. This is not a stock where net cash provides a floor, and a 59.1% equity ratio alone does not make the balance sheet bulletproof. The progressive dividend and the roughly 3.5% DOE target need to be judged by whether they can be funded after inventory and investment needs.
When the commodity cycle turns just as new capacity arrives
The biggest risk is a reversal in metal prices, the yen, and the inventory factor. FY2026’s record included commodity tailwinds, and management itself expects metals ordinary profit to fall from ¥75.1bn to ¥26.5bn. If prices fall further than planned, inventory write-downs and weaker operating cash flow would hit at the same time, pushing already negative net cash lower.
The second risk is timing on copper foil. If AI server spending pauses just as the MicroThin™ and VSP™ expansions come online, the CapEx spent up front would delay any owner earnings recovery. How the ¥60bn M&A budget is spent also matters: deals in functional materials, with its 30% ROIC target, mean something very different from deals in low-return businesses.
Smelting is energy-intensive, too. The securities report flags volatility in resource and energy prices linked to rising tension in the Middle East and restrictions on shipping through the Strait of Hormuz.
There is upside as well. Functional materials posted ¥18.2bn of ordinary profit in Q1 of FY2027, and the Q1 presentation sets a 2030 ordinary profit target of ¥150bn for the group, including ¥130bn from functional materials. That is higher than the original mid-term plan target of ¥100bn for FY2030, although I could not confirm when or on what assumptions the target was raised beyond the Q1 materials. The company also split its shares 10-for-1 on October 1. A management team that once admitted its “market cap did not improve” under the previous plan is now actively trying to widen its investor base.
Wait until the copper foil payback shows up in the numbers
Mitsui Kinzoku owns a genuinely strong business: high-share copper foil that AI servers and semiconductor packages depend on. But the FY2026 record combines that copper foil with a smelter riding commodity tailwinds. Owner earnings value exceeds the simulated market cap by about 30% only on this year’s numbers; running next year’s company plan through the same formula brings it down to about ¥1,045.7bn. Net cash is still −¥19.70bn. My stance for now is wait.
Bullish monitoring triggers
- Quarterly ordinary profit in functional materials holds at ¥19bn or more (Q1 was ¥18.2bn; the ¥78.0bn full-year guidance implies about ¥19.5bn per quarter). Check the quarterly earnings presentations.
- Monthly VSP™ sales volume holds or beats the recent 780–840 tonne range, and the MicroThin™ expansion (¥30bn total) ramps on schedule.
Warning / pass triggers
- Inventories climb further above ¥212.88bn while operating cash flow keeps trailing net income. Check the balance sheet and cash flow statement in each earnings release.
- Spending the ¥56.0bn CapEx plan and the ¥60bn M&A budget pushes net cash back below −¥19.70bn, especially if the money goes to low-ROIC deals outside functional materials.
A record year does not make this a bargain on its own. The question is how much of owner earnings the copper foil business can carry once the smelter’s commodity tailwind is gone. I would rather see that answer in the quarterly numbers before measuring the margin of safety again.
Want to simulate the "fair value" of Mitsui Mining and Smelting Company, Limited?
Interested in digging deeper into the financial data for Mitsui Mining and Smelting Company, Limited featured in this article?
At okuriru.com, you can run simulations for Mitsui Mining and Smelting Company, Limited based on Buffett-style "owner earnings." Enter your required rate of return (hurdle rate) to instantly calculate a theoretical stock price.
👉 Calculate Mitsui Mining and Smelting Company, Limited's theoretical stock price
Resolve the question "Is this stock fairly priced?" using your own criteria. CSV downloads of financial data are available too!