MITSUI E&S’s (7003) results for the fiscal year ended March 2026 contain two numbers that do not fit together. Operating profit rose to ¥37.64 billion, up 62.7% year over year, and the operating margin reached a record 10.7%. Net income attributable to owners of the parent, however, came in at ¥38.46 billion, down 1.6%. Essentially flat.
The share price has not been straightforward either. It hit a 52-week high of 8,438 yen on March 3, 2026, and closed at 4,193 yen on October 2—roughly half.
So why did net income stall while the core business earned so much more? Because what sits inside that profit changed between the two years. Last year, a ¥24.42 billion gain on selling an affiliate stake propped up net income. This year, a tax benefit did the same job (a deferred-tax adjustment of -¥9.48 billion). This article strips out those one-off items and re-measures the margin of safety using owner earnings and net cash.
Engines and Cranes: Two Franchises That Are Hard to Replace
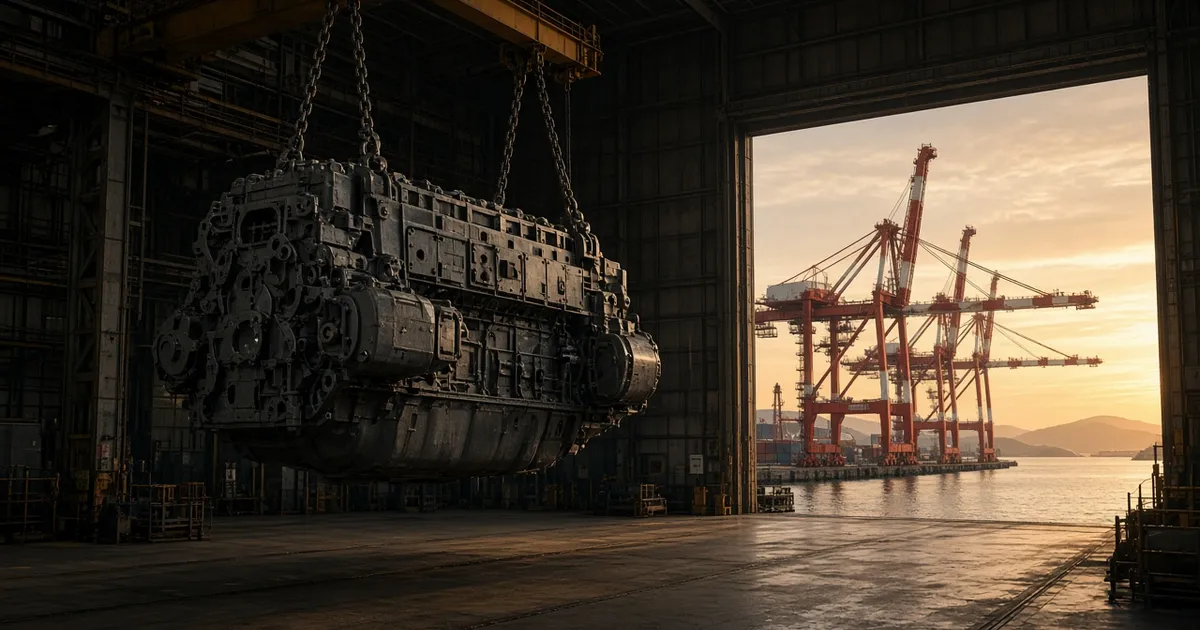
MITSUI E&S is a build-to-order heavy machinery maker centered on large marine engines and container cranes for ports. It sold its stake in MODEC and its shipbuilding subsidiary to focus on these two pillars, and today’s company is the result.
In FY2026 (ended March 2026), revenue split into Marine Propulsion Systems 42.4%, Peripheral Services 26.7%, Logistics Systems (cranes) 18.4%, and Growth Business 12.4%. By region, Japan accounted for about 67%.
On the facts, the moat comes down to three things:
- Marine engines: The company builds under two licenses, Everllence and WinGD, at its Tamano and Aioi plants. Domestic shipyard slots are full, with some orders already booked for delivery in 2030. After an engine is delivered, the company keeps earning from dry-dock work and retrofits for environmental rules. The earnings release describes aftermarket service as “strong” in both marine and logistics.
- Decarbonization: It completed 100%-load operation of an ammonia-fueled engine paired with its own fuel supply system, and finished classification and customer witness tests in February 2026. Few players can sell the whole propulsion system, fuel supply included.
- Port cranes: Its domestic order share is close to 100%. In the U.S., it won an order for two portainers for Long Beach.
The weak spots are just as clear. As a build-to-order business, any gap between estimated and actual project costs flows straight into profit. Provisions for losses on construction contracts (¥3.73 billion) and on contracts (¥3.38 billion) are still on the books. Orders are lumpy, too. After booking several large engines at once in FY2025, FY2026 orders fell to ¥315.80 billion (down 25.1%). Even so, the order backlog stands at ¥462.72 billion, roughly 1.3 years of revenue.
Operating Profit Up 63%, So Why Is Net Income Flat?
Start with revenue and net income.
| Metric | 2024 | 2025 | 2026 |
|---|---|---|---|
| Revenue (¥bn) | 301.88 | 315.11 | 353.2 |
| Net income (¥bn) | 25.05 | 39.07 | 38.46 |
| Net profit margin | 8.3% | 12.4% | 10.9% |
Revenue grew from ¥301.88 billion to ¥353.2 billion over two years. The FY2026 gain (+12.1%) came from more large and dual-fuel engines in marine and steady progress on large logistics projects. It was the existing backlog being worked through, not a jump in new orders that year.
Profit grew faster than sales. Operating profit rose from ¥23.13 billion to ¥37.64 billion, lifting the operating margin from 7.3% to 10.7%. By segment, Logistics Systems operating profit went from ¥5.95 billion to ¥13.94 billion (+134.1%), and Marine Propulsion Systems from ¥7.48 billion to ¥14.47 billion (+93.6%). Better margins on large projects and aftermarket service did the work.
Yet net income in the table slipped from ¥39.07 billion to ¥38.46 billion, and the net profit margin fell from 12.4% to 10.9%. Break it down and the reason becomes clear.
- FY2025: A ¥24.42 billion gain on the sale of affiliate shares, mainly MODEC. Operating profit from the core business was only ¥23.13 billion.
- FY2026: The sale gain shrank to ¥0.25 billion. Instead, a -¥9.48 billion deferred-tax adjustment (from recognizing deferred tax assets) kicked in, leaving total income taxes of ¥1.16 billion on pretax profit of ¥40.05 billion—a tax burden of about 2.9%. Extraordinary losses of ¥5.16 billion, including ¥1.91 billion in litigation-related losses, pushed the other way.
In other words, “flat net income” reflects a handover from asset-sale gains to core earnings. But this year’s net income still leans on a tax benefit. FY2025 also carried a -¥8.98 billion deferred-tax adjustment, so the tax burden has been unusually light two years running.
Re-tax FY2026 at the statutory effective rate (about 30.6%), and net income comes to roughly ¥27.4 billion on a pretax-profit basis. On an ordinary-profit basis, which also excludes extraordinary items, it is about ¥30.7–31.0 billion. That second figure is almost identical to management’s FY2027 net income guidance of ¥31.0 billion, and consistent with the view that normal earning power is around ¥30 billion a year.
Strip Out the Tax Benefit and the Cushion Shrinks from 1.7x to 1.2x
Next, owner earnings: net income plus depreciation, minus capital expenditure.
(* Simulation assumptions: estimated share price 4,314 yen, required return 5%)
| Metric | 2024 | 2025 | 2026 |
|---|---|---|---|
| Owner earnings (¥bn) | 25.23 | 37.064 | 37.438 |
| Owner earnings value (¥bn) | 504.6 | 741.28 | 748.76 |
Multiply the estimated share price of 4,314 yen by shares outstanding excluding treasury stock (about 100.9 million), and the implied market value is about ¥435.29 billion. FY2026 owner earnings value of ¥748.76 billion is roughly 1.7 times that. On the table alone, the stock looks quite cheap.
But FY2026 owner earnings of ¥37.44 billion are built on net income of ¥38.46 billion that includes the tax benefit. The FY2025 figure of ¥37.06 billion contains both the stake-sale gain and a tax benefit.
Recalculate owner earnings using tax-normalized net income (about ¥27.4 billion), and they come to about ¥26.3–26.6 billion (using depreciation of ¥8.08 billion and capex of ¥9.10 billion). Capitalized at a 5% required return, owner earnings value is about ¥530 billion. The cushion over implied market value shrinks from about 1.7x to about 1.2x. This is our own estimate and should be read as a hypothesis.
At about 1.2x, the stock is not expensive, but that is not a margin of safety you can call thick. Capex is also set to climb from ¥9.1 billion to ¥13.6 billion in the FY2027 plan and ¥14.9 billion in the FY2028 plan. Part of that is growth investment in capacity, but in the owner earnings math it is still a drag.
Net Cash Is Still Negative, but ¥58bn Better in Two Years
Finally, net cash on a conservative basis: (current assets − inventories) + investment securities × 70% − total liabilities.
| Metric | 2024 | 2025 | 2026 |
|---|---|---|---|
| Net cash (¥bn) | -111.818 | -84.567 | -53.845 |
| Net current asset ratio | -21.805% | -19.43% | -12.37% |
Net cash is negative. MITSUI E&S is not a net-cash company. Against interest-bearing debt of ¥92.72 billion (excluding leases), it holds ¥57.06 billion in cash and deposits.
The pace of improvement, though, is real. Net cash moved from -¥111.82 billion to -¥53.85 billion in two years, a gain of about ¥58 billion. In FY2025, proceeds from the MODEC sale went toward repaying short-term borrowings, cutting total liabilities from ¥320.6 billion to ¥275.1 billion. In FY2026, liabilities fell further to ¥260.7 billion, and higher market values on investment securities helped as well. The equity ratio rose from 30.4% to 46.3%, and in December 2025 the company obtained an issuer rating of A− from R&I.
One caveat: the FY2024 share count includes unlisted Class A preferred shares that were retired in July 2024, so treat the 2024 net current asset ratio as a reference figure only.
There is one more lens specific to build-to-order businesses. Liabilities include ¥42.91 billion of contract liabilities (customer advances), which pair with ¥60.34 billion of work in progress on the asset side. As projects advance and work in progress turns into revenue, both sides unwind together. If work in progress keeps piling up while advances shrink, net cash deteriorates.
Project Costs and Working Capital: The Test for the Next Twelve Months
The biggest near-term concern is working capital and cash flow. For FY2027, management says working-capital build will be “concentrated” in the year and guides free cash flow to ¥8.0 billion, down from ¥31.0 billion actual in FY2026 (the guide was raised from ¥6.0 billion at Q1). Q1 operating cash flow was already -¥1.4 billion, and free cash flow -¥2.2 billion. Inventories have grown three years in a row, from ¥67.7 billion to ¥69.9 billion to ¥77.9 billion.
Project cost risk remains, too. Tension in the Middle East is expected to make fuel for engine test runs and some materials harder and more expensive to source. Any top-up of loss provisions would quickly undercut the margin-improvement story.
On demand, Japan accounts for about 67% of revenue, and marine demand depends on domestic shipyard capacity. Logistics Systems orders were weak in Q1 at ¥11.4 billion (down ¥9.6 billion year over year), and management itself acknowledges slow progress.
There is good news as well. Q1 orders reached ¥105.0 billion (up ¥16.2 billion), including ¥67.1 billion in marine (up ¥25.8 billion), as previously delayed deals landed on schedule. The Q1 operating margin was 11.1%, and full-year operating profit guidance was raised from ¥32.0 billion to ¥34.0 billion (+¥2.0 billion from logistics).
The filings do not explain why the share price has halved from its high. Instead of guessing, the better use of time is to check in the numbers whether core earnings actually stay in the business as cash.
Wait—Until Orders and Operating Cash Flow Prove the Core Earnings
MITSUI E&S is shifting from a company that books profits from asset sales to one that earns its money from engines and cranes. A 10.7% operating margin, a roughly ¥58 billion improvement in net cash, and a 46.3% equity ratio all back that up.
On the other hand, tax-normalized owner earnings value is only about 1.2x the implied market value, and net cash is still -¥53.8 billion. In FY2027, working capital is set to swell and free cash flow to thin out.
Stance for now: wait. Two reasons: the margin of safety on a normalized basis is not thick, and the next few quarters are when we can confirm whether core profit is retained as cash.
Triggers to turn bullish:
- Marine Propulsion Systems orders stay on pace for the full-year outlook of ¥170 billion (Q1: ¥67.1 billion), with continued orders for dual-fuel and ammonia-fueled engines. Check segment orders in the Q2 results scheduled for November 5, 2026.
- Logistics Systems operating profit tracks above the raised ¥10 billion outlook, alongside additional portainer or transtainer orders in the U.S. and Southeast Asia. Check the quarterly segment table and order announcements.
Triggers to stay on the sidelines or turn cautious:
- Work in progress keeps rising while contract liabilities (customer advances) shrink, and operating cash flow stays negative from Q2 onward. A cut to the ¥8.0 billion free cash flow outlook, or signs of net cash slipping below -¥53.8 billion, would send the same signal.
- Top-ups to provisions for losses on construction contracts or contracts, or a revision that takes full-year operating profit guidance below the original ¥32.0 billion because of fuel and material costs tied to the Middle East.
Do not jump in on the “record margin” headline alone. Track, quarter by quarter, the earning power left after stripping out the tax benefit, and whether those earnings stay in the business as cash. That is how to read MITSUI E&S right now.
Want to simulate the "fair value" of MITSUI E&S Co., Ltd.?
Interested in digging deeper into the financial data for MITSUI E&S Co., Ltd. featured in this article?
At okuriru.com, you can run simulations for MITSUI E&S Co., Ltd. based on Buffett-style "owner earnings." Enter your required rate of return (hurdle rate) to instantly calculate a theoretical stock price.
👉 Calculate MITSUI E&S Co., Ltd.'s theoretical stock price
Resolve the question "Is this stock fairly priced?" using your own criteria. CSV downloads of financial data are available too!