MEISEI INDUSTRIAL (1976) posted ¥60.3bn of revenue (−9.0% year on year) and ¥5.49bn of net income (−35.0%) for the fiscal year ended March 2026—a clear down year. Yet order backlog rose to ¥22.5bn (+16.8%), net cash on our definition climbed to about ¥49.5bn, and the net current asset ratio exceeded 62%. Profit fell while the bridge to future revenue and the balance-sheet cushion thickened. Whether that mismatch is “real deterioration” or “a trough between large plant jobs” is the investment fork.
Thermal insulation and boilers: a specialist that works with heat
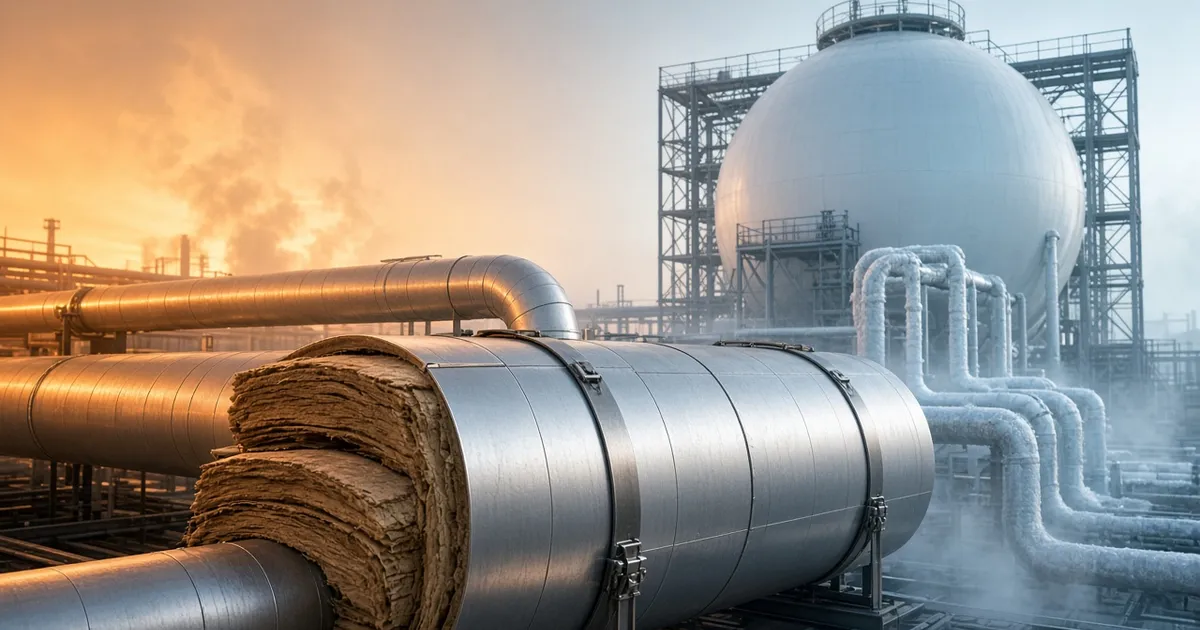
MEISEI INDUSTRIAL Co., Ltd. is a plant thermal-insulation specialist that also manufactures and installs industrial and biomass boilers. It earns from insulation work and materials for oil, petrochemicals, LNG, power, and steel plants, plus clean rooms, refrigerated facilities, and boiler products and construction. Domestically, a network of bases near industrial zones and power stations supports recurring maintenance; large new-build and retrofit jobs move in lumps.
What can work in its favor is know-how spanning ordinary insulation through LNG-class cryogenics, maintenance continuity from the domestic base network, materials manufacturing capability, and boiler exposure into combustion systems. Fragility is real: large-job timing swings revenue and profit; soft domestic petrochemical capex, price competition, labor shortages, and cost inflation stack up. Asia is a complement, but geopolitics, regulation, JVs, and construction warranties remain. Decarbonization and hydrogen/ammonia insulation tech can be upside—but only once they show up in orders and profit.
Inside the down year—large-job trough plus one-offs
| Metric | 2024 | 2025 | 2026 |
|---|---|---|---|
| Revenue (¥bn) | 60.38 | 66.28 | 60.3 |
| Net income (¥bn) | 6.24 | 8.45 | 5.49 |
| Net profit margin | 10.3% | 12.8% | 9.1% |
Revenue was ¥60.3bn, net income ¥5.49bn, and the net margin 9.1%—down from ¥66.28bn, ¥8.45bn, and 12.8%. Both construction and boilers saw fewer large jobs in progress. Construction revenue was about ¥54.1bn (−8.1%) on weaker domestic and overseas large projects; boilers about ¥6.15bn (−16.1%) on slower large-job progress. IR also notes a rebound from the prior year’s busy maintenance-outage season.
On profit, lower sales met higher personnel and other costs. Boiler segment profit more than halved on new-plant operating costs. Cash-flow commentary mixes a ¥2.88bn impairment with about ¥1.82bn of investment-securities sale gains—so treating the −35% net-income drop as a clean step-down in earning power is risky. Separately, orders were ¥63.5bn (+2.0%) and backlog ¥22.5bn (+16.8%). Boiler orders jumped about 44%, and clean-room work also saw large order and sales gains. Soft sales as a trough, backlog as forward cover—that reading fits the primary materials better than a structural collapse story.
Owner earnings fell more gently. Valuation gap is limited.
(* Simulation assumptions: estimated share price 1,724 yen, required return 5%)
| Metric | 2024 | 2025 | 2026 |
|---|---|---|---|
| Owner earnings (¥bn) | 4.89 | 5.962 | 4.97 |
| Owner earnings value (¥bn) | 97.8 | 119.24 | 99.4 |
Owner earnings ran ¥4.89bn → ¥5.962bn → ¥4.97bn. Against ¥5.49bn of net income in FY2026/3, adding ¥0.136bn of depreciation and subtracting ¥0.66bn of capex leaves about ¥4.97bn—a milder drop than accounting profit. At a 5% required return, owner-earnings value is ¥99.4bn. Treasury-adjusted simulated market value is about ¥79.4bn; issued-share web market caps sit near ¥95bn. On the treasury-adjusted base, value exceeds price; on issued shares, the gap is roughly flat. Peak-year value of ¥119.24bn (FY2025/3) leaves some cycle-recovery room, but the stock is not a deep bargain on current earnings alone.
Capex shrank in FY2026/3 and looks more sustaining than growth-accelerating. Cash generation remains, but the margin of safety in valuation is not thick.
Net cash about ¥49.5bn—a real downside cushion
| Metric | 2024 | 2025 | 2026 |
|---|---|---|---|
| Net cash (¥bn) | 42.886 | 46.197 | 49.506 |
| Net current asset ratio | 50.814% | 56.135% | 62.368% |
On our definition—(current assets − inventories) + investment securities × 70% − liabilities—net cash rose for three years: ¥42.886bn → ¥46.197bn → ¥49.506bn. The net current asset ratio climbed from 50.8% to 56.1% to 62.4%. Total assets about ¥85.6bn, liabilities about ¥16.1bn, cash and equivalents about ¥36.7bn. Operating cash flow was about +¥6.5bn; securities sales helped free cash flow, and cash still rose despite dividends and buybacks.
Against an issued-share market value near ¥95bn, net cash of about ¥49.5bn is conspicuously thick. That is not “buy because cash is fat”—it is a cushion that can absorb a trough between large plant jobs.
Risks—if the trough lasts, thickness alone is not enough
The main risk is prolonged soft domestic petrochemical and power capex, leaving a large-job gap that maintenance cannot fill. Construction warranties on overseas and large projects, Asia political/regulatory/JV risk, sticky material and labor costs, and skilled-labor shortages remain. Repeated impairments and securities-sale gains also blur the gap between reported profit and true owner earnings. Management itself is cautious that the mid-term plan’s final year may miss profit targets on inflation. Decarbonization and cryogenic/hydrogen themes are attractive stories, but keep them as upside until orders and profit show the link.
Wait. Let backlog test the trough hypothesis
MEISEI is a mid-small construction-related name with specialist plant-insulation skill and thick net cash. The FY2026/3 down year is fact, but rising backlog and cash make “large-job trough plus one-offs” more coherent than “earning-power collapse.” Still, ¥99.4bn of owner-earnings value versus the current price is not a deep bargain; the margin of safety is limited.
Stance for now: wait. To turn constructive, we want backlog holding or re-expanding roughly above ¥20bn, with revenue recovery following. Warning signs are backlog peaking out while revenue keeps falling, and maintenance alone failing to cover the large-job gap.
Monitoring Triggers for Investment Decisions
- Signals to Buy: Earnings releases and IR decks show order backlog holding or re-expanding roughly above ¥20bn, with revenue recovery following in later periods. Underlying profit, stripping impairments and sale gains, does not thin sharply.
- Signals to Pass: Backlog peaks out while revenue keeps falling together. Or maintenance sales cannot fill the large-job gap, and construction warranties or overseas risks cut profit hard.
Want to simulate the "fair value" of MEISEI INDUSTRIAL Co.,Ltd.?
Interested in digging deeper into the financial data for MEISEI INDUSTRIAL Co.,Ltd. featured in this article?
At okuriru.com, you can run simulations for MEISEI INDUSTRIAL Co.,Ltd. based on Buffett-style "owner earnings." Enter your required rate of return (hurdle rate) to instantly calculate a theoretical stock price.
👉 Calculate MEISEI INDUSTRIAL Co.,Ltd.'s theoretical stock price
Resolve the question "Is this stock fairly priced?" using your own criteria. CSV downloads of financial data are available too!