For the fiscal year ended December 2025, IDEA Consultants, Inc. (9768) posted record highs in orders, revenue, and net income. Revenue reached ¥24.62bn and net income ¥2.38bn. Operating profit, however, slipped to ¥3.19bn—a (2.1% year-over-year decline).
The cash picture is even stranger. Net income was essentially flat, yet owner earnings jumped from ¥0.78bn to about ¥2.25bn—roughly a threefold increase. The same year shows accounting “higher sales, lower operating profit” and a sharp rise in cash-generating power side by side. Is this environmental and construction consultancy—more than 80% tied to the public sector—simply sitting in a CapEx valley? Or are renewable-energy assessments and the domestic AUV starting to change how the numbers look? That gap is the lens for this memo.
Bundling Environmental Assessment and Construction Consulting—“Eyes for the Ocean”
IDEA is a comprehensive consultancy built around environmental assessment, biology, chemical analysis, and ocean surveys, plus construction consulting for rivers, roads, and bridges. Environmental consulting is about 65% of consolidated revenue (¥15.96bn of ¥24.62bn). The profit model is professional services: win survey, planning, design, and analysis work from government and public-interest bodies, then earn the spread after specialist labor, outsourcing, and equipment costs. Operating margins generally run in the low-to-mid teens (around 12–13%).
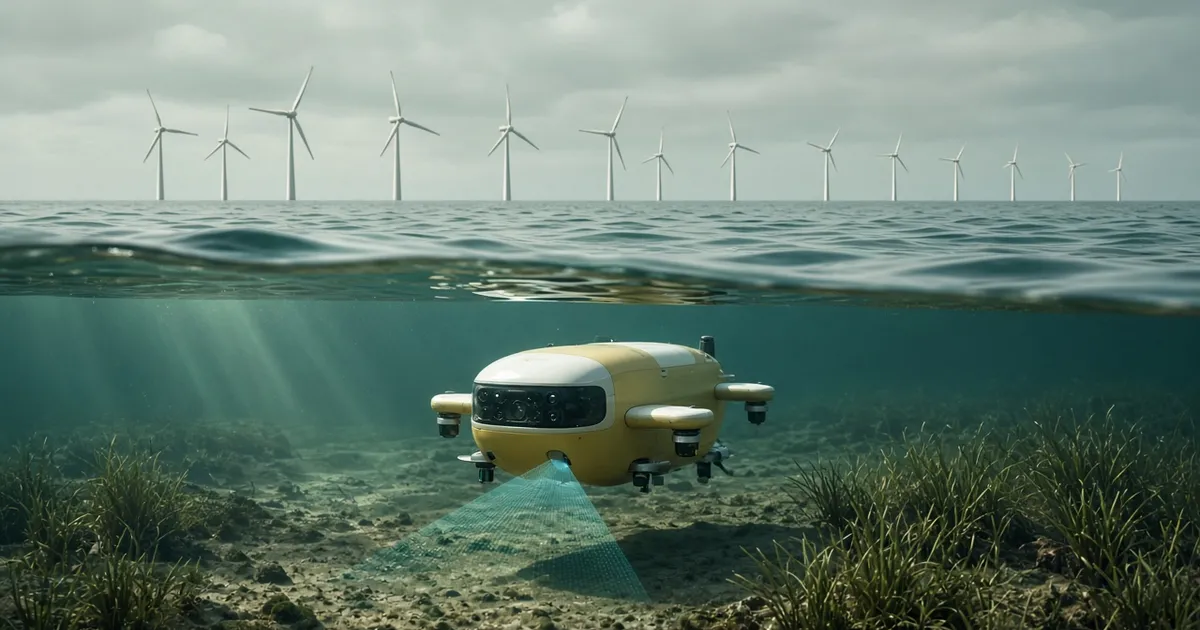
What can look like a moat is the ability to cover planning through survey, analysis, forecasting, design, countermeasures, and management in one chain. Differentiating niches—self-designed hovering AUV “YOUZAN,” underwater inspection demos for floating offshore wind, environmental DNA and PFAS analysis—sit outside plain public civil-engineering consulting.
The frail side is equally clear. (More than 80% of revenue) comes from government and public-interest clients, so public works budgets and execution matter directly. Competition for national and local work stays intense, and front-loaded spending on people, DX, and priority fields can squeeze operating profit—exactly what 2025’s higher sales and softer operating income illustrate.
Why Operating Profit Softened While Revenue Hit a Record
First, the revenue and profit trend.
| Metric | 2023 | 2024 | 2025 |
|---|---|---|---|
| Revenue (¥bn) | 22.7 | 24.31 | 24.62 |
| Net income (¥bn) | 1.99 | 2.38 | 2.38 |
| Net profit margin | 8.8% | 9.8% | 9.7% |
Revenue rose steadily from ¥22.7bn to ¥24.62bn, and net income held a record ¥2.38bn. Drivers included renewable-energy environmental assessments, AUV design/build and operations support, and large-scale ocean surveys. Environmental consulting grew 1.5%; construction consulting was roughly flat (−0.2%). Orders also hit a record ¥25.12bn, so the pipeline itself has not cracked.
Management attributes the slight operating-profit decline to higher personnel costs from human-capital investment, higher cost of sales from priority-field investment, and DX spending. The operating margin is still a healthy 12.9%. The honest read is record-pace top line with operating profit thinned a little by investment.
Did Owner Earnings Triple Because Growth Arrived—or Because CapEx Eased?
Owner earnings show cash left for owners after the accounting noise.
(* Simulation assumptions: estimated share price 3,715 yen, required return 5%)
| Metric | 2023 | 2024 | 2025 |
|---|---|---|---|
| Owner earnings (¥bn) | 0.78 | 1.464 | 2.248 |
| Owner earnings value (¥bn) | 15.602 | 29.271 | 44.97 |
Owner earnings rose from ¥0.78bn to ¥1.464bn to ¥2.248bn; capitalized at a 5% required return, owner-earnings value is about ¥45bn. Estimated market cap at the 3,715-yen assumed price is about ¥26.5bn. Lined up that way, the stock looks cheap versus owner-earnings value.
The surge, though, is not mainly a leap in net income. CapEx fell from ¥1.94bn to ¥1.10bn to ¥0.88bn, with depreciation around ¥0.75bn in 2025. Flat net income plus lower cash outlays inflate owner earnings. The sixth mid-term plan still targets roughly ¥7–9bn of growth and priority-field investment, including large items such as aircraft, labs, and measurement gear. Today’s owner earnings likely reflect a post-planting valley; the next CapEx crest could squeeze them again. Treating the jump as proof of permanent growth is premature.
¥11.5bn of Net Cash: Downside Cushion or Seed Capital for the Next Cycle?
Then the balance sheet.
| Metric | 2023 | 2024 | 2025 |
|---|---|---|---|
| Net cash (¥bn) | 7.944 | 9.778 | 11.536 |
| Net current asset ratio | 29.952% | 36.869% | 43.498% |
Net cash climbed from ¥7.944bn to ¥11.536bn, and the net current asset ratio is about 43.5%. Equity ratio is 81.2% and the current ratio 396%—this is not a leverage story. Versus the ~¥26.5bn estimated market cap, net cash is about 43% of that figure, a thick downside cushion.
Cash on hand still fell by about ¥0.85bn, while trade receivables and contract assets rose by about ¥0.54bn. Operating cash flow was ¥1.20bn versus ¥4.01bn a year earlier. A strong balance sheet and tighter working-capital cash conversion belong in the same frame. The cash pile is both a safety buffer and dry powder for mid-term growth spending—which way it tips depends on the next investment pace.
Eighty-Percent Public Dependence and the Risk of CapEx Re-acceleration
The core risk is that more than 80% of revenue depends on government and public-interest clients. If public works and related tech budgets shrink, renewable-energy assessment and AUV stories alone will not fill the hole. Intense bid competition, thinner margins, and delivery defects or temporary bidding bans are also native risks for environmental and construction consultants.
Sustainability of owner earnings is the other watchpoint. The 2025 jump leaned on CapEx easing; if the mid-term’s ¥7–9bn of investment concentrates, cash-based value creation will look harder again. Overseas and real-estate segments are too small to dilute the public-sector and environmental core.
Investor Takeaway: Wait in the CapEx Valley, With Explicit Triggers
My current stance is wait.
Two reasons. First, simultaneous records in orders, revenue, and net income plus ¥11.5bn of net cash are attractive, but the roughly 3x owner-earnings jump likely reflects a CapEx-cycle valley more than a permanent step-up. Second, the gap between ~¥26.5bn estimated market cap and ~¥45bn owner-earnings value is intriguing, yet calling the stock “cheap” before confirming CapEx re-acceleration and the quality of public orders would be hasty. AUV and offshore wind can become a second engine, but quantitative disclosure of their contribution is still thin—story alone is not enough to buy.
Triggers to turn bullish:
- Orders stay roughly positive year over year, and earnings/IR commentary keeps citing renewable-energy assessments and AUV-related work.
- Operating margin holds above about 11% (near the 12% neighborhood) even under investment load.
Triggers to stay on the sidelines / turn more cautious:
- Mid-term growth investment (about ¥7–9bn) concentrates and owner earnings clearly buckle.
- Orders keep declining year over year, or the operating margin falls below about 10%.
Want to simulate the "fair value" of IDEA Consultants,Inc.?
Interested in digging deeper into the financial data for IDEA Consultants,Inc. featured in this article?
At okuriru.com, you can run simulations for IDEA Consultants,Inc. based on Buffett-style "owner earnings." Enter your required rate of return (hurdle rate) to instantly calculate a theoretical stock price.
👉 Calculate IDEA Consultants,Inc.'s theoretical stock price
Resolve the question "Is this stock fairly priced?" using your own criteria. CSV downloads of financial data are available too!