In the fiscal year ended March 2026, Iida Group Holdings lifted net income to ¥63.32bn and the net profit margin to 4.2%. At the same time, net cash sank to −¥461.27bn and the net current asset ratio to −75.2%. Profits improved while the balance sheet got heavier—how should investors read this “earnings rebound paired with deeper leverage”?
This article looks at Japan’s largest-scale detached-home builder alliance through owner earnings, net cash, and inventory risk, and explains why a simple “cheap stock” call is premature.
A Multi-Brand Machine Built on Land and Turnover
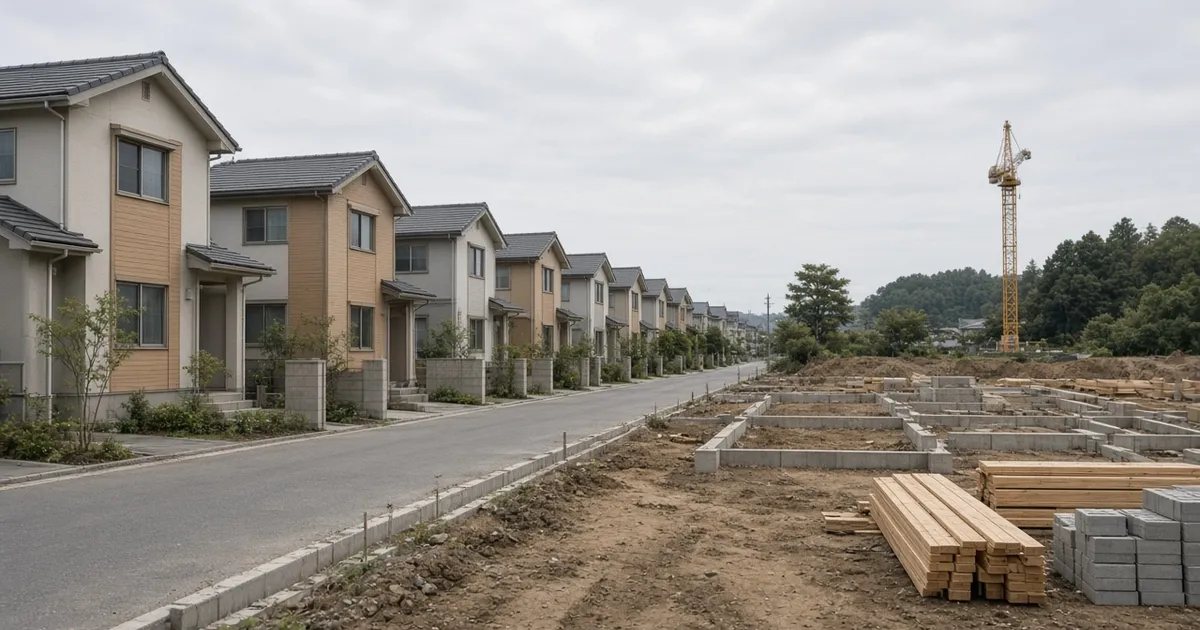
Iida Group HD bundles brands such as Ichiken, Iida Sangyo, Toei Housing, Tact Home, Earnest One, and ID Home across price points and specs. With roughly 81 consolidated subsidiaries, the core model is land acquisition → construction → for-sale housing. Of ¥1,508.86bn in FY2026 revenue, detached-home sales were about 80.8%.
Potential edges include group-scale procurement and operations that improved the finished-inventory ratio, plus full ZEH-level coverage. Barriers to entry are still low, and results stay sensitive to rates, land prices, and first-time buyer sentiment. Treat it as an “inventory-turn business"—that is the right starting point for valuation.
Fewer Units, Higher Prices, Better Margins
| Metric | 2024 | 2025 | 2026 |
|---|---|---|---|
| Revenue (¥bn) | 1439.18 | 1459.64 | 1508.86 |
| Net income (¥bn) | 37.2 | 50.7 | 63.32 |
| Net profit margin | 2.6% | 3.5% | 4.2% |
Revenue rose for a third straight year, and net income climbed from ¥37.2bn to ¥63.32bn. The net profit margin improved from 2.6% to 4.2%. Detached-home unit sales fell, but average selling prices rose and the segment gross margin reached 16.0% (+2.1pt). Expo-related costs of about ¥5bn plus higher headcount lifted SG&A, yet operating and bottom-line profit still grew.
Covering fewer units with higher prices may also signal shifts in demand mix and regional mix. Accounting earning power has recovered; cash retention is a separate question.
Owner Earnings Value Above Market Cap—With Caveats
(* Simulation assumptions: estimated share price 2,219 yen, required return 5%)
| Metric | 2024 | 2025 | 2026 |
|---|---|---|---|
| Owner earnings (¥bn) | 19.65 | 38.775 | 39.291 |
| Owner earnings value (¥bn) | 393.0 | 775.5 | 785.82 |
Owner earnings expanded from ¥19.65bn to ¥39.291bn. Capitalized at a 5% required return, owner earnings value is about ¥785.8bn. At the assumed 2,219 yen share price, estimated market capitalization is roughly ¥613bn—so owner earnings value sits above market cap on a simple comparison.
Still, owner earnings of ¥39.291bn trail net income of ¥63.32bn, reflecting growth that absorbs inventory builds. Operating cash flow was about −¥97.5bn, driven mainly by inventory growth, and free cash flow was deeply negative. The gap between “accounting recovery” and “cash left behind” helps explain why the discount does not close overnight.
−¥461bn Net Cash Is the Real Downside Weight
| Metric | 2024 | 2025 | 2026 |
|---|---|---|---|
| Net cash (¥bn) | -321.477 | -296.68 | -461.271 |
| Net current asset ratio | -51.7% | -48.4% | -75.2% |
Net cash here uses a conservative definition: current assets excluding inventories, plus 70% of investment securities, minus liabilities. At end-FY2026 it stood at −¥461.27bn, with the net current asset ratio at −75.2%. Cash fell, borrowings rose, and inventories reached ¥966bn.
Management describes uncontracted inventory as appropriate versus this year’s plan, and the finished-inventory ratio improved—so the build is not necessarily disorderly. Absolute size still matters: inventory write-downs in a downturn are core risk. Even with owner earnings value above market cap, an enterprise-value lens that includes net debt does not support a blunt “undervalued” call.
When Inventory, Rates, and Demand Hit Together
Inventory write-downs
Against ¥966bn of inventory, weaker land prices or demand can hit earnings and equity directly.Rising rates and buyer intent
Large net debt means higher mortgage rates pressure both demand and financing costs.Execution of growth bets
U.S. housing M&A and goodwill, plus plans to carve out remodeling as a separate segment, aim to cut detached-home dependence—but also bring impairment and plan-miss risk. Expo costs of about ¥5bn look one-off; inventory-plus-debt expansion is structural.
Final Call: Wait, With Clear Triggers
Iida Group HD has shown a recovery in earning power via better gross margins and near-record net income. Owner earnings value exceeds estimated market cap. Yet −¥461bn of net cash and heavy inventory leave little room to ignore downside resilience.
The stance for now is “wait”. Do not buy on the cheap-looking multiples alone; watch whether cash generation and inventory quality improve.
Triggers to turn bullish (Buy signals)
- Operating cash flow turns positive, and inventory growth realigns with revenue growth (quarterly CF and inventory-turn disclosures)
- After remodeling becomes a separate segment, sales and gross margin do not materially miss company plans (FY2027 guidance: ¥25.8bn sales, 28.7% gross margin)
Triggers to heighten caution (Pass signals)
- Further net-cash deterioration, or continued inventory spikes that break the “appropriate” story for finished-inventory ratio and uncontracted stock
- Under rising rates and softer demand, detached-home gross margins fall again and write-downs or goodwill impairments return
Want to simulate the "fair value" of Iida Group Holdings Co.,Ltd.?
Interested in digging deeper into the financial data for Iida Group Holdings Co.,Ltd. featured in this article?
At okuriru.com, you can run simulations for Iida Group Holdings Co.,Ltd. based on Buffett-style "owner earnings." Enter your required rate of return (hurdle rate) to instantly calculate a theoretical stock price.
👉 Calculate Iida Group Holdings Co.,Ltd.'s theoretical stock price
Resolve the question "Is this stock fairly priced?" using your own criteria. CSV downloads of financial data are available too!