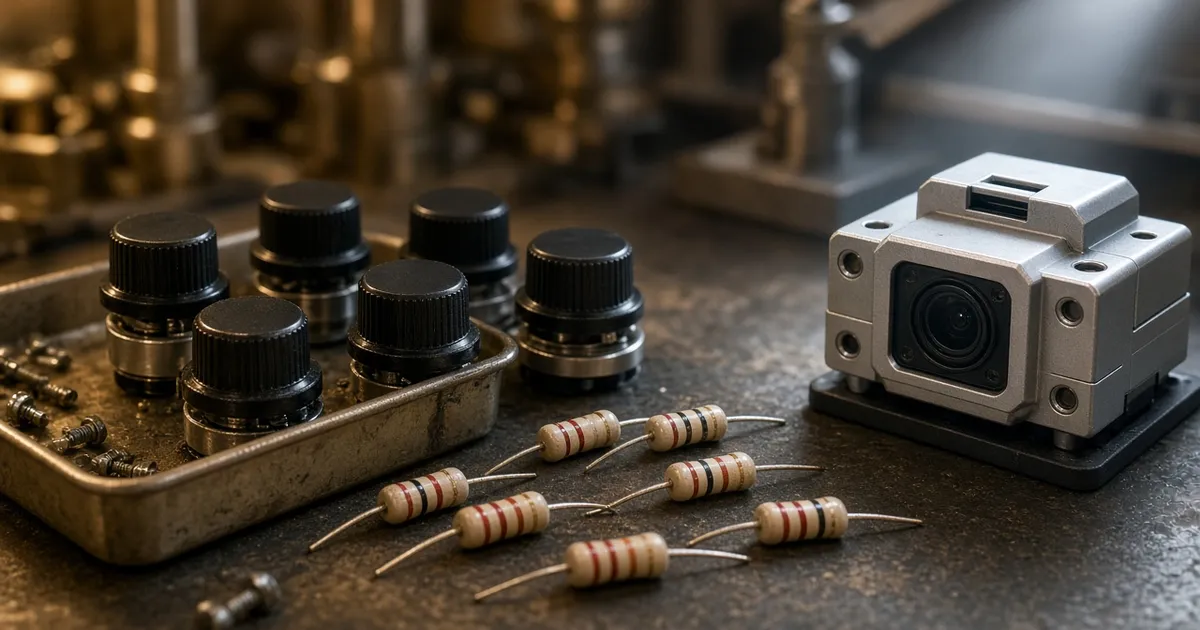
Many investors still pigeonhole Teikoku Tsushin Kogyo (NOBLE) as a “cash-rich, old-school components stock.” Net cash exceeds ¥15 billion and the equity ratio sits above 80%. On those numbers alone, a downside-protection story writes itself. The FY2026 reality is less tidy. Revenue reached ¥17.26 billion—near a record high—while net income fell to ¥1.27 billion and the net profit margin slipped to 7.4%. When sales rise but profits shrink, balance-sheet thickness alone cannot settle the investment case. This article asks what investors should actually watch as the company evolves from a resistor maker into a sensor-oriented business.
A Components Maker That Wins Through Spec Integration
Beyond variable and fixed resistors, the company builds front-operation blocks (ICB) and sensors that are engineered around customer specifications. Its edge comes from an integrated production setup spanning materials, processing, and assembly, plus early-stage design proposals. In FY2026 product sales, front-operation blocks contributed ¥4.99 billion and sensors ¥4.41 billion, ahead of variable resistors at ¥2.11 billion and fixed resistors at ¥2.05 billion. This is less a pure commodity-parts price fight and more a business that embeds itself in customer control and sensing functions, creating sticky design wins and production transfers. Automotive electronics, AV, and medical/healthcare demand have been firm, while industrial equipment and amusement have been softer. The Medium-Term Management Plan 2030 targets growth in automotive HVAC position sensors, medical/healthcare electrodes and electrochemical sensors, and newer areas such as IoT and leak detection. The strategic direction is clear; whether it restores margins is still unproven.
A Year When Higher Sales Did Not Protect Margins
Revenue and profit tell different stories.
| Metric | 2024 | 2025 | 2026 |
|---|---|---|---|
| Revenue (¥bn) | 15.22 | 16.79 | 17.26 |
| Net income (¥bn) | 1.36 | 2.01 | 1.27 |
| Net profit margin | 9.0% | 12.0% | 7.4% |
Revenue rose from ¥15.22 billion to ¥17.26 billion. Net income, however, fell from ¥2.01 billion in FY2025 to ¥1.27 billion in FY2026, and the margin compressed from 12.0% to 7.4%. Company materials credit higher sales, price pass-throughs, productivity gains, and a weaker yen as positives, while material cost inflation and higher labor and overhead costs were the main drags. The question now is less “Can sales grow?” and more “Can growth be turned back into profit?” The FY2027 company plan calls for ¥18.0 billion in revenue and ¥1.5 billion in operating profit. Continued pass-throughs and efficiency gains could support a rebound, but that still assumes some easing—or at least better absorption—of material and labor pressure.
Margin Pressure Shows Up in Owner Earnings Too
Beyond accounting profit, owner earnings show how much cash the business can retain while staying intact.
(* Simulation assumptions: estimated share price 2,756 yen, required return 5%)
| Metric | 2024 | 2025 | 2026 |
|---|---|---|---|
| Owner earnings (¥bn) | 1.534 | 1.904 | 0.882 |
| Owner earnings value (¥bn) | 30.68 | 38.084 | 17.647 |
Owner earnings dropped from ¥1.904 billion in FY2025 to ¥0.882 billion in FY2026. The implied owner earnings value also shrank from ¥38.084 billion to ¥17.647 billion. Against an estimated market capitalization around ¥25.9 billion, simply extrapolating the latest depressed earnings does not make a clean “cheap” case. If FY2025-type profitability returns, the valuation picture changes quickly. Treat this less as an automatic asset bargain and more as a watch-and-reassess name keyed to margin recovery.
Thick Net Cash Is Comfort—Not a Buy Signal by Itself
For downside resilience, look at net cash and the net current asset ratio.
| Metric | 2024 | 2025 | 2026 |
|---|---|---|---|
| Net cash (¥bn) | 16.733 | 17.913 | 15.128 |
| Net current asset ratio | 63.3% | 67.8% | 58.5% |
Net cash stands at ¥15.128 billion and the net current asset ratio at 58.5%—still a wide safety cushion. The equity ratio of 82.5% also makes financial durability hard to dismiss. A high net current asset ratio, though, also signals low capital efficiency. The medium-term plan targets a DOE guideline of about 5% and ¥1.5 billion of buybacks over three years. Whether surplus cash is actually compressed and redeployed will drive any re-rating. Do not stop at “cash-rich equals safe”; ask whether that cash improves ROE and returns to shareholders.
Costs and Cyclical End Markets Can Keep Squeezing Profit
The main risk is persistent inflation in materials, energy, and labor. If higher sales keep failing to protect profits, the sensor-evolution narrative alone will struggle to move the stock. End markets such as autos, consumer electronics, and industrial equipment are also sensitive to demand cycles and inventory swings, so mix shifts can jolt results. Production and sales exposure in China and the rest of Asia adds geopolitical and supply-chain risk. Balancing large investments with shareholder returns is constructive in principle, but turning a rich balance sheet into better ROE is still a work in progress.
The Verdict
Teikoku Tsushin Kogyo is both a cash-rich legacy components maker and a company pushing into sensors. Right now, the priority is not balance-sheet thickness; it is whether the margin hit from higher sales and higher costs reverses. My current stance is wait: the balance sheet is solid, but evidence of profit recovery is still required.
I will watch the following triggers:
- Bullish triggers: Operating margin returns to the 8% range from FY2027 onward, and quantitative disclosures show progress in medical/healthcare, automotive sensors, and IoT/electrochemical sensor sales or mass production. Check earnings releases, earnings presentations, and medium-term plan updates.
- Bearish triggers: Sales keep rising but operating profit misses plan again on material and labor inflation, or large investments and shareholder returns fail to lift ROE and cash compression remains talk rather than delivery. Check quarterly results, guidance revisions, annual filings, and buyback execution disclosures.
I will not buy on cash thickness alone. I want to see sensor expansion show up as margin recovery in the numbers before looking for an entry.
Want to simulate the "fair value" of Teikoku Tsushin Kogyo Co.,Ltd.?
Interested in digging deeper into the financial data for Teikoku Tsushin Kogyo Co.,Ltd. featured in this article?
At okuriru.com, you can run simulations for Teikoku Tsushin Kogyo Co.,Ltd. based on Buffett-style "owner earnings." Enter your required rate of return (hurdle rate) to instantly calculate a theoretical stock price.
👉 Calculate Teikoku Tsushin Kogyo Co.,Ltd.'s theoretical stock price
Resolve the question "Is this stock fairly priced?" using your own criteria. CSV downloads of financial data are available too!