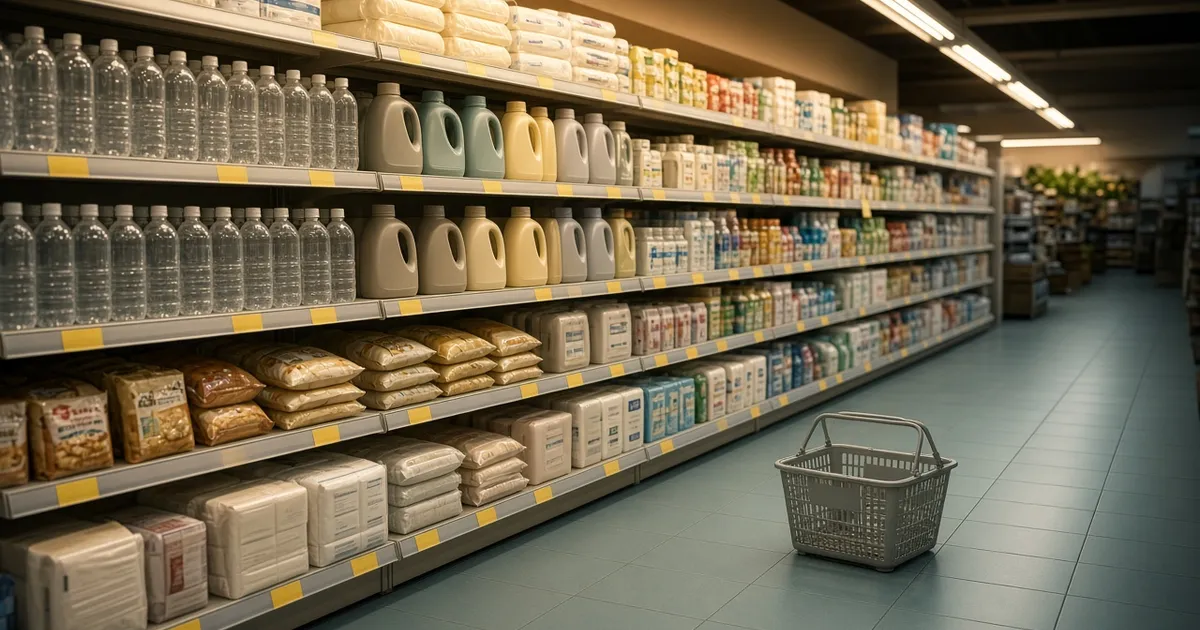
In the fiscal year ended February 2026, Mr Max Holdings posted record revenue of ¥147.68bn, and existing-store sales rose to 106.4% of the prior year. The company rode household defensive demand in rice and daily goods, and lifted its private-brand mix to 22.2%. Yet the net profit margin stayed at 1.8%, and owner earnings dropped from ¥2.63bn to ¥1.148bn. Traffic is there; thickness is not. That gap—winning on price without converting it into durable margins—is the right starting point for this stock.
A Kyushu-rooted discount model built on EDLP
Mr Max Holdings is a general discount retailer selling appliances, household goods, apparel, and food through self-service stores. It also operates shopping centers and a logistics subsidiary for 3PL, but store retail is the earnings core.
The playbook is everyday low prices (EDLP) backed by everyday low cost (EDLC). The group ended the year with 59 stores after opening two and renovating seven, keeping its northern Kyushu base while stretching into the Tokyo area. High-frequency categories drive traffic; private brands and hot products help mix and gross profit.
Revenue climbs while the margin wall holds
| Metric | 2024 | 2025 | 2026 |
|---|---|---|---|
| Revenue (¥bn) | 129.57 | 136.57 | 147.68 |
| Net income (¥bn) | 2.44 | 2.48 | 2.72 |
| Net profit margin | 1.9% | 1.8% | 1.8% |
Sales rose for a third straight year, and net income reached ¥2.72bn. Company-wide store sales hit a record, helped by broad rice assortment during shortages, value-focused detergents and processed foods, and products such as Nintendo Switch 2. Private-brand sales grew 14.7% year on year to 22.2% of revenue—an encouraging mix shift.
Gross margin still held flat at 21.9%, and the net margin stayed at 1.8%. A higher food mix capped gross profit, while wage inflation and depreciation absorbed the gain. Operating profit improved to about ¥4.45bn, but that remains far from the medium-term plan for FY2029: ¥200bn in revenue, ¥10bn in operating profit, and a 5.0% operating margin. Winning the value shopper does not automatically mean earning a higher return.
Store investment is squeezing owner earnings
(* Simulation assumptions: estimated share price 750 yen, required return 5%)
| Metric | 2024 | 2025 | 2026 |
|---|---|---|---|
| Owner earnings (¥bn) | 1.383 | 2.63 | 1.148 |
| Owner earnings value (¥bn) | 27.66 | 52.6 | 22.96 |
Even as net income rose, owner earnings fell from ¥2.63bn in 2025 to ¥1.148bn in 2026 because capital spending jumped to about ¥4.39bn. New stores and renovations can build tomorrow’s sales base, but they cut free cash flow today. Owner earnings value stands at ¥22.96bn against an implied market value of about ¥24.99bn at the 750-yen simulation price—and recent market capitalization sits higher still. The market already seems to price a fair amount of future margin expansion.
Net cash stays deeply negative
| Metric | 2024 | 2025 | 2026 |
|---|---|---|---|
| Net cash (¥bn) | -41.678 | -40.203 | -39.886 |
| Net current asset ratio | -167.136% | -161.027% | -159.581% |
On a conservative definition, net cash is about -¥39.9bn—a working-capital-heavy retail balance sheet. The trend has stopped getting worse, but this is not a cash-cushion story. Inventories, store assets, and trade payables keep the model running; they do not create a wide margin of safety from excess cash.
Risks are also clear: Kyushu concentration, retail competition, wage inflation, private-brand quality control, hiring, and slow DX execution. M&A and overseas expansion remain early-stage ideas and are hard to treat as near-term valuation drivers.
Wait for a real margin breakthrough
Mr Max is well placed for defensive household demand, and the existing-store strength plus private-brand mix look real. What remains is thin profitability, investment-heavy owner earnings, and a weak net-cash buffer. We can see the company win traffic; we cannot yet see it keep a thicker share of that revenue.
Stance for now: wait. Do not treat discount retail as automatically defensive. Watch whether private brands and productivity gains lift the operating margin.
Monitoring Triggers for Investment Decisions
- Signals to Buy: In full-year or quarterly materials, private-brand mix rises further and the operating margin improves sustainably from the low-3% area. Existing-store sales stay positive without SG&A efficiency deteriorating as new stores ramp.
- Signals to Pass: Gross margin slips again under a heavier low-price mix, so sales growth fails to lift profit. Or capital spending keeps owner earnings depressed and the 5% medium-term operating-margin target drifts further away.
Want to simulate the "fair value" of Mr Max Holdings Ltd.?
Interested in digging deeper into the financial data for Mr Max Holdings Ltd. featured in this article?
At okuriru.com, you can run simulations for Mr Max Holdings Ltd. based on Buffett-style "owner earnings." Enter your required rate of return (hurdle rate) to instantly calculate a theoretical stock price.
👉 Calculate Mr Max Holdings Ltd.'s theoretical stock price
Resolve the question "Is this stock fairly priced?" using your own criteria. CSV downloads of financial data are available too!