Imagine a company that has posted net profits for 17 consecutive years, maintains an equity ratio above 60%, and recently generated roughly ¥0.28 billion in owner earnings annually, all while sitting on over ¥0.53 billion in net cash. If I told you this robust, cash-generating business was left trading at a mere ¥2.4 billion market capitalization in the stock market, how would you evaluate it?
Today, we take a closer look at Kensoh (7939), the top player in the metal signage industry. Let’s unravel the true picture of the deep value concealed behind its numbers and examine the hurdles the company currently faces.
A Niche Champion Shaping Cityscapes
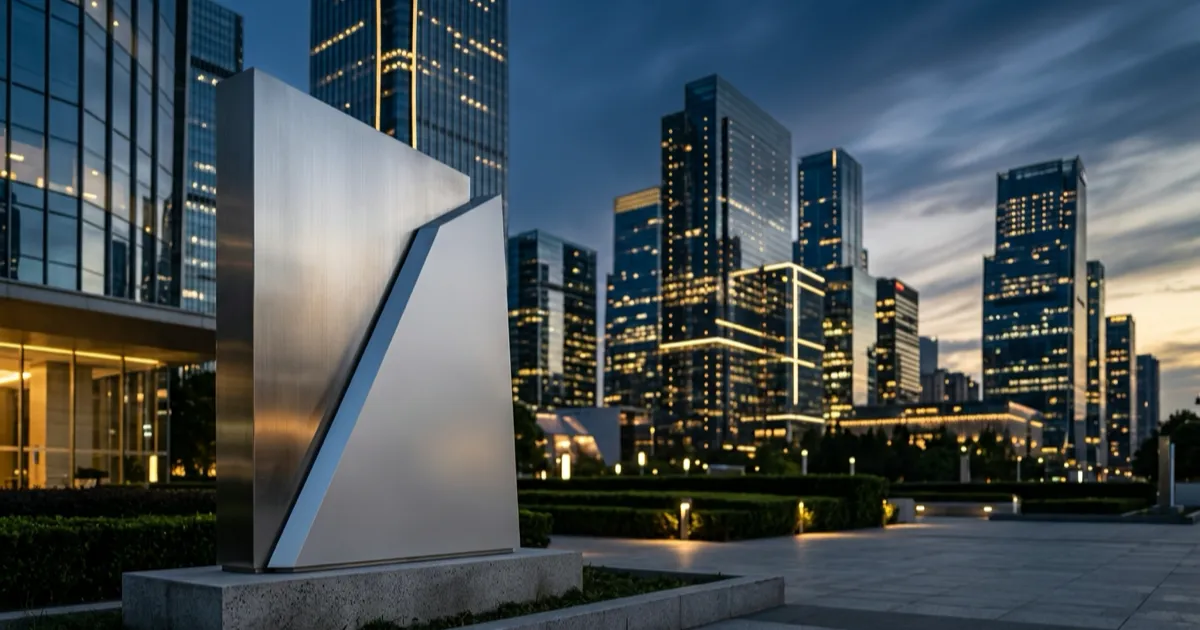
Kensoh operates a one-stop business model covering everything from planning and design to manufacturing and installation of metal signs (such as directory boards and monuments) for commercial facilities, office buildings, and public infrastructure.
Rather than just being a simple signboard shop, their strength lies in delivering custom-made signage nationwide that functions as an integral part of spatial design. Particularly in urban redevelopment projects, developers demand high-quality, cohesive sign systems. Over the years, Kensoh has built a stable order base backed by its proven track record, installation expertise, and nationwide sales network. In fact, their 17 consecutive years of bottom-line profitability serve as compelling evidence of this resilient business model.
However, their current operating environment is far from smooth sailing. While they enjoy strong tailwinds from nationwide urban redevelopment, they are simultaneously caught in a severe squeeze between soaring construction material costs and rising labor expenses.
The Margin Squeeze from Inflation
First, let’s review the company’s recent sales and profit trends to understand its current situation.
| Metric | 2024 | 2025 | 2026 |
|---|---|---|---|
| Revenue (¥bn) | 5.89 | 5.87 | 6.41 |
| Net income (¥bn) | 0.18 | 0.18 | 0.21 |
| Net profit margin | 3.1% | 3% | 3.2% |
For the fiscal year ending March 2026, revenue expanded to ¥6.41 billion, aided by contributions from large-scale redevelopment projects, and net income reached ¥0.21 billion. However, a glance at the net profit margin reveals it is hovering in the low 3% range, which hardly characterizes a highly lucrative structure.
This is primarily because signage products are made-to-order (a flow-based business model), and the company’s margins are being squeezed by the rising costs of raw materials like steel and acrylic, as well as increasing labor costs at construction sites. The data clearly shows a structural challenge: even as top-line revenue grows, it remains difficult to retain a substantial portion of those earnings.
Decoding True Cash Generation
Next, let’s step away from accounting profits and focus on the actual cash left in the business—owner earnings—to verify its valuation.
(* Simulation assumptions: estimated share price 600 yen, required return 5%)
| Metric | 2024 | 2025 | 2026 |
|---|---|---|---|
| Owner earnings (¥bn) | 0.11 | 0.135 | 0.286 |
| Owner earnings value (¥bn) | 2.204 | 2.708 | 5.723 |
What stands out here is the sharp increase in owner earnings to ¥0.286 billion for the fiscal year ending March 2026. Generating this much cash in a single year against a market cap of ¥2.4 billion (based on an estimated share price of ¥600) is a fact that cannot be ignored. Discounting these owner earnings at a 5% required rate of return yields an owner earnings value of ¥5.723 billion, suggesting that the current market cap is significantly undervalued relative to its actual cash-generating ability.
However, a caveat is necessary: this jump in cash generation partly reflects a temporary lull in capital expenditures (CapEx). The company’s medium-term management plan emphasizes the mechanization and automation of production processes, meaning that future owner earnings could fluctuate depending on the timing and scale of these investments.
A Financial Fortress Defending the Downside
In value investing, checking the downside resilience is indispensable. Let’s look at their margin of safety.
| Metric | 2024 | 2025 | 2026 |
|---|---|---|---|
| Net cash (¥bn) | 0.241 | 0.339 | 0.536 |
| Net current asset ratio | 10% | 14% | 22.2% |
As of March 2026, net cash reached ¥0.536 billion, meaning the company retains cash equivalent to roughly 22% of its entire market cap. Coupled with a solid equity ratio of 60.8%, Kensoh has ample durability to withstand temporary downturns, such as those caused by construction delays. Despite the market’s apparent pessimism, their financial margin of safety is remarkably thick.
Buy Case, Pass Case, and What to Watch
Kensoh represents a classic value stock where the macro benefits of redevelopment are entangled with the micro struggles of cost inflation. Considering the stability of its 17-year profitable streak, its robust financial base, and the excessive pessimism seemingly priced into the current stock level, downside risk appears limited, making it an attractive investment proposition.
Nevertheless, as a flow-type business devoid of recurring revenue, it faces constant pressure to secure new orders. If profit margins continue to stagnate, there is an inherent risk that the stock will remain perpetually undervalued.
For future investment decisions, I will be monitoring the following triggers:
Bullish Catalyst: A sustained improvement in the operating profit margin beyond 4.5%. If the company successfully passes rising material costs onto clients and the cost reductions from its planned mechanization and automation materialize in the financials, it could spark a rapid upward re-rating of the stock. Tracking progress through quarterly earnings and briefing materials will be essential.
Bearish Catalyst: The operating profit margin settling below 3.5% with an accelerating trend of profit decline. This would signal an inability to withstand inflationary pressures despite top-line growth, resulting in a structural failure to generate cash. I would pass on the investment in this scenario. Furthermore, significant delivery delays due to stalled redevelopment projects also warrant close caution.
Will it fall into a value trap, or will its intrinsic value eventually be recognized? I intend to keep a close watch on the evolution of this unpretentious, yet vital, company that supports our urban landscapes.
Want to simulate the "fair value" of KENSOH CO.,LTD.?
Interested in digging deeper into the financial data for KENSOH CO.,LTD. featured in this article?
At okuriru.com, you can run simulations for KENSOH CO.,LTD. based on Buffett-style "owner earnings." Enter your required rate of return (hurdle rate) to instantly calculate a theoretical stock price.
👉 Calculate KENSOH CO.,LTD.'s theoretical stock price
Resolve the question "Is this stock fairly priced?" using your own criteria. CSV downloads of financial data are available too!