Technoflex has recently reported an explosive 2.4-fold year-over-year increase in net income, reaching ¥3.12 billion. At first glance, it looks like an incredible growth story. However, peeling back the layers reveals that this figure includes one-off tailwinds, such as extraordinary gains from real estate sales and special demand from advanced semiconductor plant constructions in Hokkaido. If we strip away these temporary boosts, how should we evaluate the company’s true earnings power? Let’s dive in to see if this is just riding a wave or a genuine structural shift toward a high-value niche model.
The Piping King’s High-Margin Playbook
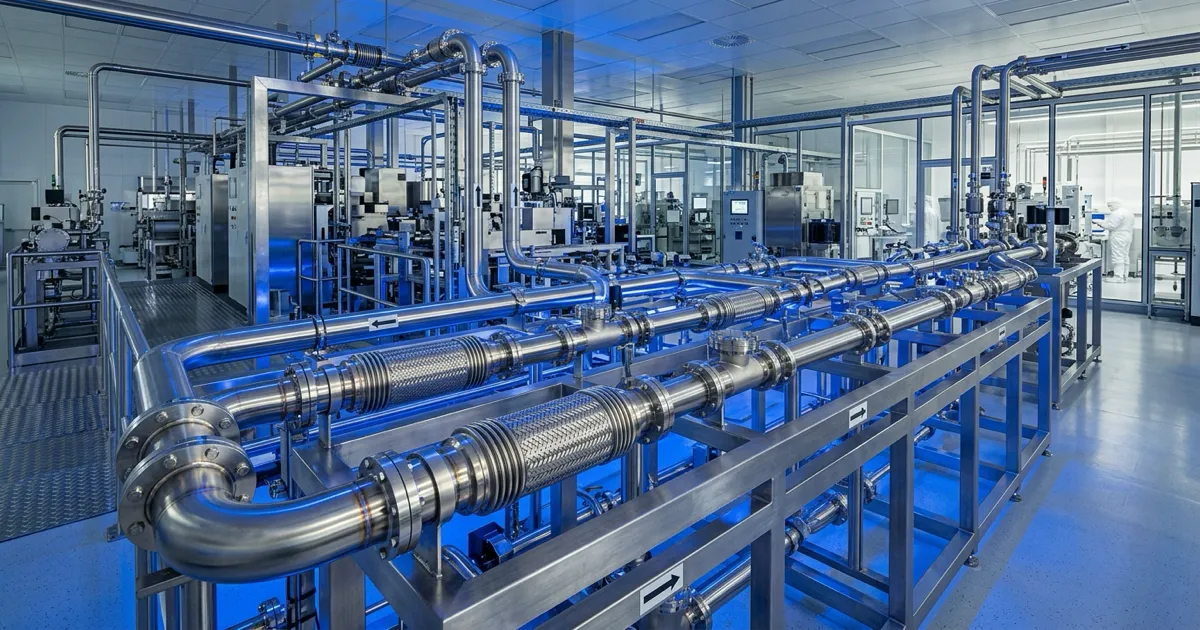
At its core, Technoflex is a hardware company that manufactures metal joints, piping components, and handles piping facility construction. While it may seem like a traditional, low-profile infrastructure and manufacturing business, the current driver of the company is not general-purpose products, but a strategic expansion into high-value niche sectors.
Particularly noteworthy is the demand for vacuum equipment used in semiconductor manufacturing and piping for clean energy, such as hydrogen and nuclear power. With ongoing orders for liquid hydrogen carrier projects and participation in pilot designs for next-generation innovative reactors (SMRs), its future growth drivers are materializing. Shifting its position from a simple piping parts maker to a critical module supplier meeting highly advanced technical requirements is the source of its strong wide moat and competitive advantage.
Sustainability of the Margin Expansion
| Metric | 2023 | 2024 | 2025 |
|---|---|---|---|
| Revenue (¥bn) | 21.24 | 22.04 | 26.03 |
| Net income (¥bn) | 0.97 | 1.31 | 3.12 |
| Net profit margin | 4.5% | 6.0% | 12.0% |
In 2025, the company achieved substantial growth with revenue of ¥26.03 billion and net income of ¥3.12 billion. What stands out here isn’t just the top-line growth (+18.1%), but the net profit margin doubling from 6.0% to 12.0%.
The operating profit margin, which reflects core business profitability, also improved dramatically from 10.0% in the previous year to 15.1%. This is the result of a shift toward high-value vacuum equipment and successful price pass-throughs, evolving into a highly leveraged earnings structure where profits grow faster than revenue. Overseas revenue has also reached ¥3.52 billion (13.5% of total sales), reducing the company’s over-reliance on domestic construction and capital investment cycles. However, it is fair to note that the current net income includes a real estate sale (an extraordinary gain of ¥655 million) with an after-tax impact of roughly ¥450 million. A more realistic view of their core net income would be around ¥2.67 billion.
Free Cash Flow and Intrinsic Value
(* Simulation assumptions: estimated share price 3,915 yen, required return 5%)
| Metric | 2023 | 2024 | 2025 |
|---|---|---|---|
| Owner earnings (¥bn) | -1.27 | -1.01 | 3.09 |
| Owner earnings value (¥bn) | -25.43 | -20.17 | 61.79 |
Owner earnings, which had sunk into negative territory for the past two years, turned into a massive surplus of ¥3.09 billion in 2025. This was driven by the completion of active capital investments and a significant expansion of operating cash flow from core operations to ¥5.22 billion.
The company is currently planning new factory constructions and expansions in Kumamoto, Niigata, and Hokkaido, amounting to approximately ¥2 billion. While an increase in depreciation expenses is inevitable, their current robust operating cash flow generation capacity should comfortably absorb it. The surge in owner earnings value indicates that their investments in high-value products have entered the harvesting phase.
Downside Resilience of the Balance Sheet
| Metric | 2023 | 2024 | 2025 |
|---|---|---|---|
| Net cash (¥bn) | 5.17 | 4.01 | 6.51 |
| Net current asset ratio | 7.2% | 5.6% | 9.1% |
Financial safety remains extremely solid. By 2025, net cash has accumulated to ¥6.51 billion. Despite actively pursuing capital investments, they have firmly secured liquidity on hand, providing a substantial margin of safety against macroeconomic deterioration or market fluctuations.
The Dilemma of Semiconductor Cycles and Capex
Behind the strong performance lie risks that cannot be ignored. One is the risk of a reactionary drop once the special demand for semiconductor-related construction, particularly in Hokkaido, subsides. The profitability of the disaster prevention and construction business may have strongly benefited from this, and vigilance is required if margins contract during a demand trough.
Another concern is the increase in fixed costs due to the full-scale construction and expansion of domestic factories from 2026 onward. If the capacity expansions in Kumamoto and Niigata do not perfectly align with the ramp-up of next-generation demand like SMRs and hydrogen carriers, the resulting low utilization rates and heavy depreciation burdens could temporarily squeeze owner earnings.
Assessing the True Value
Today’s Technoflex is transforming from a simple piping parts manufacturer into a high-value niche company supporting the “vacuum, hydrogen, and nuclear” sectors. Even when factoring out the temporary tailwinds of real estate gains and semiconductor special demand, its core profitability (around ¥2.67 billion in real net income) is genuine.
For a bullish watchlist trigger, I would look for maintaining an overseas revenue growth rate of over 15% annually in the joints business and a segment operating profit margin exceeding 18%, along with specific disclosures of order expansions for the hydrogen supply chain and SMR products. If these materialize, the structural shift is real, making it a compelling long-term investment.
On the flip side, a bearish watchlist trigger would be a sharp drop in the operating profit margin of the disaster prevention and construction business (from 15.1% to under 10%) due to a pause in semiconductor construction, or a renewed deterioration in owner earnings caused by low utilization of the new factories. Should these signs appear, the risk of fading special demand would warrant passing on the investment. At present, however, considering the earnings momentum and strong financial foundation, I believe we are in a phase to look for buying opportunities.
Want to simulate the "fair value" of TECHNOFLEX CORPORATION?
Interested in digging deeper into the financial data for TECHNOFLEX CORPORATION featured in this article?
At okuriru.com, you can run simulations for TECHNOFLEX CORPORATION based on Buffett-style "owner earnings." Enter your required rate of return (hurdle rate) to instantly calculate a theoretical stock price.
👉 Calculate TECHNOFLEX CORPORATION's theoretical stock price
Resolve the question "Is this stock fairly priced?" using your own criteria. CSV downloads of financial data are available too!