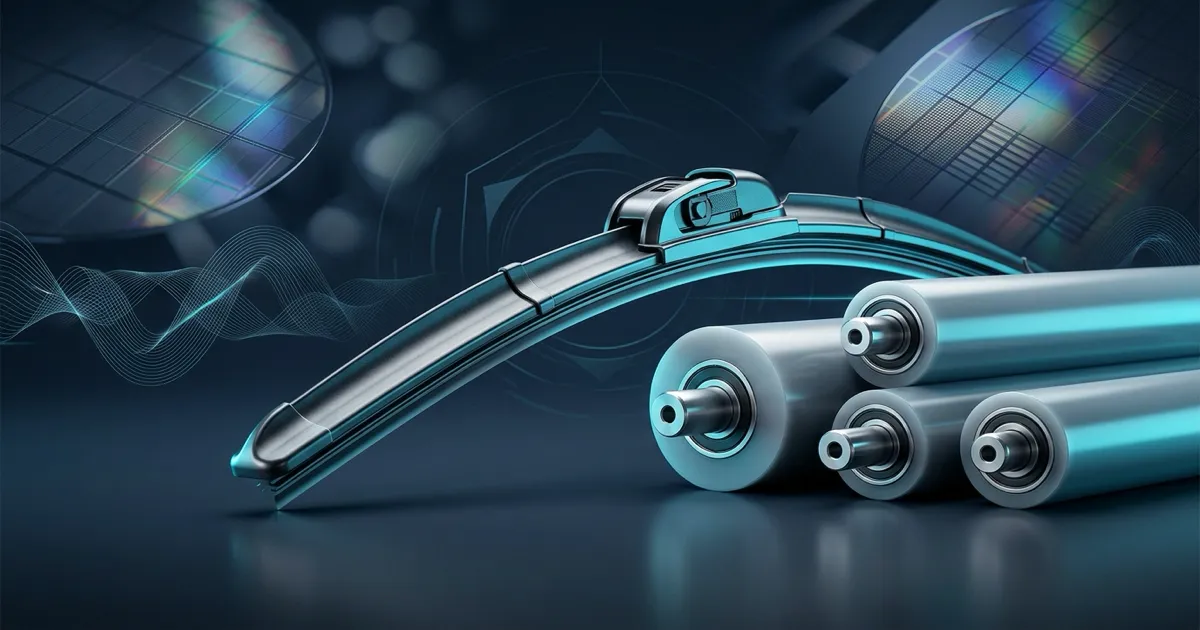
58% global market share. When you see this number, what kind of invincible blue-chip company comes to mind?
Fukoku Co.,Ltd. (5185), headquartered in Saitama, Japan, is the absolute king of wiper blade rubber, literally controlling the majority of the global market for automakers.
However, a glance at their latest earnings reveals a jarring negative surprise: a (61% year-over-year plunge) in net income. What exactly is happening to a global niche leader with such overwhelming competitive strength? Let’s dive into the financials and uncover the signs of structural transformation hidden behind this temporary setback.
Beyond Rubber: Building a Wide Moat in New Frontiers
Fukoku’s greatest strength is undoubtedly its massive market share in wiper blade rubber, which recently expanded further from 50% to 58%. This isn’t just about supplying raw rubber components. They have built a deep solution business that dictates the design specifications of the entire wiper system, deeply penetrating local Chinese and European automakers.
But what makes the company truly fascinating right now is how they are leveraging this highly advanced polymer and rubber technology into completely new, high-value arenas.
For instance, they already command a 30% global share in urethane rollers used for manufacturing semiconductor silicon wafers—a sector booming alongside AI and data centers. Furthermore, their vibration-damping technology has been selected for JAXA’s Space Strategy Fund projects, and they are expanding thermal gap fillers for EVs. They are steadily shedding their skin as a traditional auto parts supplier.
Deciphering the Profit Plunge
So why did their recent performance take such a hit? Let’s look at the numbers.
| Metric | 2024 | 2025 | 2026 |
|---|---|---|---|
| Revenue (¥bn) | 88.85 | 89.66 | 90.03 |
| Net income (¥bn) | 3.05 | 2.93 | 1.14 |
| Net profit margin (%) | 3.4 | 3.3 | 1.3 |
Revenue has crept up for three consecutive years, reaching the 90 billion yen mark (around ¥90bn). Yet, net income plummeted from ¥2.93bn to ¥1.14bn.
The biggest culprit is a one-time impairment loss on fixed assets in the anti-vibration business, amounting to (¥0.91bn). However, there is another structural issue we cannot ignore: the operating deficit in Japan.
While the company rakes in ¥2.2bn in operating profit from the ASEAN and India regions, the domestic Japanese business is bleeding an operating loss of ¥0.6bn due to delayed price adjustments against soaring raw material and labor costs. The structure currently relies on overseas earnings to cover domestic losses. Fixing this domestic leak is their most critical challenge.
True Cash Generation and Valuation
Next, let’s bypass the accounting illusions and check the owner earnings to see how much actual cash is being generated.
(* Simulation assumptions: estimated share price 2,065 yen, required return 5%)
| Metric | 2024 | 2025 | 2026 |
|---|---|---|---|
| Owner earnings (¥bn) | -1.71 | 1.42 | -4.57 |
| Owner earnings value (¥bn) | -34.22 | 28.32 | -91.46 |
Owner earnings have sunk into negative territory. While operating cash flow remains solid at over ¥8bn, it is entirely offset by massive investment cash outflows—primarily (roughly ¥5.2bn in capital expenditures) for property, plant, and equipment.
This aggressive spending includes the construction of a new plant in North America. We are witnessing a phase of heavy upfront investment to secure future growth. They are currently digging for cash, but once these facilities come online and start contributing to the bottom line, the financial landscape will drastically change.
Financial Resilience During the Transition
With such heavy investments ongoing, how much financial leeway does Fukoku actually have?
| Metric | 2024 | 2025 | 2026 |
|---|---|---|---|
| Net cash (¥bn) | 12.29 | 12.75 | 10.81 |
| Net current asset ratio (%) | 36.9 | 38.3 | 36.8 |
The answer is: plenty. They hold roughly ¥10.8bn in net cash, maintaining a net current asset ratio of 36.8%. This means they operate essentially debt-free, possessing an incredibly sound balance sheet.
Even during a period of strained profits and free cash flow, this thick cash cushion provides a substantial margin of safety. In fact, management recently boosted the dividend payout ratio target from 30% to 40% and drastically raised the dividend floor from 20 yen to 50 yen. This dramatic enhancement in shareholder returns is a move only a company with a rock-solid financial foundation can afford to make.
Potential Headwinds
Of course, optimism must be tempered with caution. The slowdown in global BEV adoption and potential production cuts by automakers amid geopolitical tensions in the Middle East could inflict direct damage. The company itself has released a conservative forecast for the fiscal year ending March 2027, expecting a (13.2% year-over-year drop in operating profit).
Furthermore, the lingering question remains: when will the domestic business finally turn profitable? Breaking the negative cycle of delayed price pass-throughs is easier said than done.
The Value Investor’s Verdict
The undisputed king of wipers is currently navigating a transitional period, pivoting its business structure towards semiconductors, space, and EV thermal management. Coupled with aggressive shareholder returns, the narrative is becoming quite compelling.
However, my current investment stance is to wait and see. I need more clarity on the timeline for when these upfront investments will start generating returns and whether domestic profitability can truly be restored.
Triggers to turn bullish: I will reconsider if the Japanese domestic business (currently running a ¥0.6bn deficit) shows clear signs of a turnaround toward profitability in upcoming quarterly reports, or if we see distinct revenue growth from new CASE and semiconductor products like urethane rollers.
Triggers to pass: If the company fails to pass on soaring raw material costs, causing the consolidated operating margin to stagnate further and fall short of their conservative ¥3.3bn operating profit forecast, I will continue to pass.
I am willing to patiently wait out the growing pains until their investments finally bear fruit.
Want to simulate the "fair value" of Fukoku Co.,Ltd.?
Interested in digging deeper into the financial data for Fukoku Co.,Ltd. featured in this article?
At okuriru.com, you can run simulations for Fukoku Co.,Ltd. based on Buffett-style "owner earnings." Enter your required rate of return (hurdle rate) to instantly calculate a theoretical stock price.
👉 Calculate Fukoku Co.,Ltd.'s theoretical stock price
Resolve the question "Is this stock fairly priced?" using your own criteria. CSV downloads of financial data are available too!