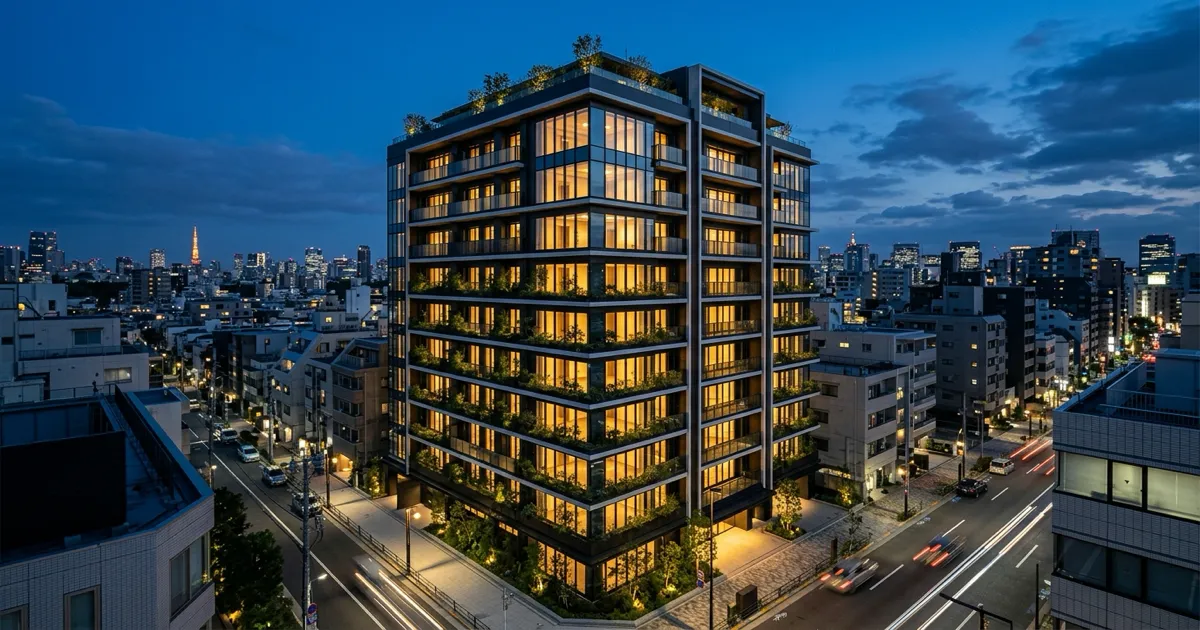
They just posted their highest-ever profit and completely cleared out their finished condo inventory. For a real estate developer, things couldn’t look better. Yet, the company is officially forecasting a profit decline for the next fiscal year, deliberately declaring a “crouching phase.”
Today, we’re digging into the financial data of Meiwa Estate (8869), a comprehensive developer known for its “CLIO” condo series in the Tokyo metropolitan area. Despite executing a massive 90.2 billion yen land acquisition—nearly double the previous year—they are projecting a near-term revenue gap. This seemingly contradictory situation actually reveals a highly calculated “breather” phase, masking a shrewd growth strategy unique to smart developers.
The Added Value of “CLIO” and a Unique Pipeline
Meiwa Estate operates under an integrated “build, sell, and manage” system. Everything from carefully selecting land to planning, designing, direct sales, and post-delivery management is handled within the group.
The biggest strength of this model is high customer satisfaction and brand power. In fact, they rank highly in Oricon’s customer satisfaction surveys for condo management in the Tokyo area, and properties priced at 100 million yen or more now make up about 60% of their sales. The reason they can maintain high profit margins despite soaring construction material costs is entirely thanks to this pricing power.
What’s even more interesting is their procurement strategy. In the fiercely competitive Tokyo area, they avoid fruitless bidding wars by acquiring real estate holding companies (real estate M&A) and engaging in condo rebuilding projects. Furthermore, they are actively cultivating asset-light businesses with high capital efficiency, such as condo management and real estate brokerage, driving up the company’s overall ROIC.
Peak Profits and a Lean Balance Sheet
First, let’s look at the trends in revenue and profits.
| Metric | 2024 | 2025 | 2026 |
|---|---|---|---|
| Revenue (¥bn) | 71.25 | 79.9 | 90.11 |
| Net income (¥bn) | 2.78 | 2.9 | 3.83 |
| Net profit margin (%) | 3.9 | 3.6 | 4.2 |
For the fiscal year ending March 2026, they achieved record profits with a revenue of 90.1 billion yen and an operating profit of 7.75 billion yen (up 47.9% year-on-year). While the number of units delivered only slightly increased, a shift towards high-end properties priced over 100 million yen pushed up the average unit price, leading to a significant improvement in gross margins. Rapid growth in their resale business and completed settlements for high-net-worth wealth solutions also contributed.
Even more remarkable is their finished inventory. They started the year with 135 unsold units, but by the end of the term, this number had plummeted to just “2 units”. The biggest burden for a developer—stagnant inventory—has been wiped clean, leaving their balance sheet incredibly lean.
Assessing True Earning Power Through Owner Earnings
Next, let’s move past accounting profit and look at owner earnings—the true cash-generating power attributable to shareholders.
(* Simulation assumptions: estimated share price 840 yen, required return 5% *)
| Metric | 2024 | 2025 | 2026 |
|---|---|---|---|
| Owner earnings (¥bn) | 2.335 | 2.131 | 3.376 |
| Owner earnings value (¥bn) | 46.7 | 42.62 | 67.52 |
Owner earnings for March 2026 surged to 3.37 billion yen. The successful sale of finished inventory pushed operating cash flow into positive territory, making a huge contribution here.
Considering the current market capitalization is around 19.7 billion yen, the owner earnings value of 67.5 billion yen suggests a massive margin of safety. However, as a value investor, we have to ask: “Why is the market leaving it at this price?”
A Temporary Cash Outflow for Future Leaps
Let’s check their net cash to measure downside resilience.
| Metric | 2024 | 2025 | 2026 |
|---|---|---|---|
| Net cash (¥bn) | 12.927 | -14.269 | 26.277 |
| Net current asset ratio (%) | 65.6 | -72.4 | 133.4 |
The glaring negative net cash in March 2025 immediately catches the eye. This was due to an aggressive 90.2 billion yen investment in land acquisition (an increase in inventory) and M&A activities—nearly double the previous year’s amount.
However, by March 2026, they recovered this capital through inventory sales, causing net cash to V-shape back up to 26.2 billion yen. This cash level alone significantly exceeds their current market cap, pushing the net current asset ratio over 133%. From a liquidity standpoint, they have more than enough stamina to weather a moderate downturn in the market.
The Inevitable “Breather” and Upfront Costs
So, why does the stock price remain so cheap? The answer lies in a structural “breather” phase the company is about to enter.
Due to longer construction periods caused by labor reforms in the construction industry, as well as extended lead times for redevelopment and M&A projects, condo sales material for the fiscal years ending March 2027 and March 2028 is expected to drop into the 40 billion yen range (compared to 55.1 billion yen in 2026).
Meanwhile, because of that massive 90.2 billion yen land purchase, upfront advertising expenses for these upcoming properties will hit in March 2027. Consequently, the company is forecasting a drop in both revenue and profit for the upcoming year. The market is likely holding off on its evaluation, wary of this temporary earnings dip, persistently high construction and labor costs, and the risk of buyers pulling back due to rising mortgage rates.
Final Call as an Investor
In conclusion, Meiwa Estate is an excellent developer with a formidable financial base and a unique pipeline, but for now, it’s a wait.
They have a clear scenario where revenue material expands back over 60 billion yen after the March 2029 fiscal year. However, if construction delays worsen or if rising interest rates cool down real demand, that carefully laid pipeline might not generate the expected profits. Just because the current price looks attractive doesn’t mean we should blindly ignore the uncertainties of a two-year transition period.
That being said, depending on how things unfold, this could turn into a massive opportunity. I will be monitoring the following points to potentially flip my stance.
Triggers to turn bullish:
- In quarterly earnings materials, checking if the high-end properties scheduled for delivery in March 2027 are steadily accumulating “condo contract volume” at high margins that justify the upfront advertising costs.
- Ensuring the “wealth solutions sales progress"—which is supposed to fill the gap left by fewer condo sales—is advancing as planned and steadily contributing to profits.
Triggers to pass or increase caution:
- If the “finished inventory”, which was beautifully reduced to just 2 units, starts piling up again due to price hikes or buyers holding back.
- If they announce further delays in the schedules of “large M&A and redevelopment projects” (like Asakusabashi, Shinkoiwa, or Tachikawa) that are meant to drive growth from 2029 onward.
Meiwa Estate has deliberately chosen to crouch down after its peak to prepare for the next jump. I’ll be keeping a close eye on their quarterly progress to see if they can successfully navigate this calculated breather.
Want to simulate the "fair value" of Meiwa Estate Company Limited?
Interested in digging deeper into the financial data for Meiwa Estate Company Limited featured in this article?
At okuriru.com, you can run simulations for Meiwa Estate Company Limited based on Buffett-style "owner earnings." Enter your required rate of return (hurdle rate) to instantly calculate a theoretical stock price.
👉 Calculate Meiwa Estate Company Limited's theoretical stock price
Resolve the question "Is this stock fairly priced?" using your own criteria. CSV downloads of financial data are available too!